The Journal of Advances in Parasitology
Research Article

Effects of Lesion Distribution on the Hematology and some Biochemical Indices of Sarcoptes scabiei Infested West African Dwarf Goat
Remigius Ibe Onoja*, Shodeinde Vincent Olumuyiwa Shoyinka
Department of Veterinary Pathology and Microbiology, Faculty of Veterinary Medicine, University of Nigeria, Nsukka, Enugu State, Nigeria.
Abstract | The clinicopathology of Sarcoptes scabiei infestation in the West African Dwarf goat was evaluated in a natural transmission study. Twenty five adult male West African Dwarf (WAD) goats consisting of fifteen naturally infested goats assigned into three equal groups based on severity of clinical disease as: A (mild infestation), B (moderate infestation), C (severe infestation), and ten healthy WAD goats with no previous history of mange infestation assigned into two equal groups as D (for contact transmission experiment) and uninfested control (E) were used for this study. There were significant (p < 0.05) reductions in Packed cell volume, Hemoglobin and Erythrocyte count mean values of the goats naturally infested with Sarcoptes scabiei compared to uninfested control group E throughout the period of study. There were no significant (p > 0.05) differences in some erythrocytic indices (Mean corpuscular volume, Mean corpuscular hemoglobin and Mean corpuscular hemoglobin concentration) among the five groups of WAD goats. However, there was a significant (p < 0.05) increase in mean Total leukocyte count (TLC) in groups B and C compared to groups A, D and the control, E. The increase in TLC was accompanied by a significant (p < 0.05) increase in both the absolute neutrophil and lymphocyte counts in groups B and C compared to groups A and E. Serum biochemical assay showed significant (p < 0.05) reduction in mean total protein in severely infested group C compared to groups A, B, D and E. There was no significant (p > 0.05) variation in mean serum albumin, globulin and creatinine levels among the groups throughout the period of study. This study has established that sarcoptic mange in WAD goat alters the hematology and serum chemistry.
Keywords | Sarcoptes scabiei, sarcoptic mange, WAD goats, haematology and biochemistry
Editor | Muhammad Imran Rashid, Department of Parasitology, University of Veterinary and Animal Sciences, Lahore, Pakistan.
Received | January 10, 2016; Revised | March 22, 2016; Accepted | March 28, 2016; Published | April 18, 2016
*Correspondence | Remigius Ibe Onoja, Department of Veterinary Pathology and Microbiology, Faculty of Veterinary Medicine, University of Nigeria, Nsukka, Enugu State, Nigeria; Email: remiwrites@yahoo.com
Citation | Onoja RI, Shoyinka SVO (2016). Effects of lesion distribution on the hematology and some biochemical indices of Sarcoptes scabiei infested West African Dwarf goat. J. Adv. Parasitol. 3(3): 66-74.
DOI | http://dx.doi.org/10.14737/journal.jap/2016/3.3.66.74
ISSN | 2311-4096
Copyright © 2016 Onoja and Shoyinka. This is an open access article distributed under the Creative Commons Attribution License, which permits unrestricted use, distribution, and reproduction in any medium, provided the original work is properly cited.
INTRODUCTION
Sarcoptic mange, scabies or sarcoptidosis is a parasitic skin disease that has been described in more than 100 species of mammals including man (Ibrahim and Abu-Samra, 1987; Scott, 1988; Bornstein et al., 2001). The disease is characterized by intense pruritus, dermatitis, alopecia, emaciation, weakness, anorexia, very high morbidity and mortality in domestic and farm animals (Amsalu et al., 2000; Walton et al., 2004; Giadinis et al., 2011). The mite inflicts severe damage to the hosts’ skin by forming tunnels within the upper epidermal layers (Morris and Dunstan, 1996) and transmission is believed to be by direct contact with infested domestic or wild animals, formites, pasture and flies (Kral and Schwartanan, 1964; Andrews, 1983; Jackson et al., 1983; Anderson et al., 2002; Curtis, 2004). Despite the economic and health importance of Sarcoptes scabiei infestation in both animal and human population, the pathogenicity, pathogenesis and pathology of the disease is poorly understood (Bornstein and Zakrisson, 1993, Skerrat et al., 1999; Rambozzi et al., 2007).
Available reports on the clinicopathology of sarcoptic mange in rabbits, dogs, foxes, sheep, camels, goats, pigs, coyotes and wild raccoon are inconsistent (Sheahan, 1975; Arlian et al., 1988a, 1995; Dalapati et al., 1996; Gorakh et al., 2000; Parmar et al., 2005; Hafeez et al., 2007; Shoyinka et al., 2009). Such inconsistencies are most probably the result of host differences or severity of disease. However, the tendency by previous workers to ignore the fact that the degree of severity is most likely to be directly related to the degree of systemic involvement in sarcoptic mange, adds to the difficulty of comparing the results of available and probably conflicting reports. It is therefore necessary to have a better understanding of the pathophysiology of Sarcoptes scabiei infestations of goats using hematologic and biochemical parameters based on the severity of clinical disease. The objective of this study is to evaluate the effects of sarcoptic mange on the hematology and some biochemical indices in WAD goat.
MATERIALS AND METHODS
Experimental Animals and Housing
A total of twenty five male West African Dwarf (WAD) goats between eight and twelve months of age were divided into two groups of fifteen naturally infested (Batch A) goats with varying degrees of alopecia/dermatitis and ten healthy (Batch B) goats were used in this study.
Mite infestation was clearly demonstrated in Batch A goats before being selected for the study while batch B goats were selected because they were free of mites and signs associated with scabies. The Batch A goats were procured from different households/livestock farms with diagnosed outbreaks of sarcoptic mange, and sarcoptes scabiei demonstrated in their skin scrapings. Such goats had varying degrees of itching, dermatitis, excoriation, alopecia and crusts on affected areas of the body. The Batch B goats were purchased from households/livestock farms that had no clinical history of sarcoptic mange infestation over the previous one year. The two groups of WAD goats were housed separately at the Experimental Animal House Unit of the Department of Veterinary Pathology and Microbiology, University of Nigeria, Nsukka.
The group B goats were acclimatized for two weeks during which they were dewormed with levamisole hydrochloride and clinically evaluated to ensure that they were free of cutaneous/systemic infectious/non-infectious disease conditions.
Feeding
The animals were fed daily with freshly cut grasses tied in bundles and suspended in each pen using a wire loop.
Experimental Design
The fifteen naturally infested WAD goats were purposively selected and assigned into three groups (A, B and C) of five goats each, based on the degree of skin lesions while the ten healthy goats were randomly divided into two groups (D and E) of five goats each as follows:
Group A (Mild - grade 1). Infested, with gross lesion affecting ≤ 1/3 of body surface.
Group B (Moderate – grade 2). Infested, with gross lesion affecting > 1/3 but ≤ 2/3 of body surface.
Group C (Severe-grade3). Infested, with gross lesion affecting more than 2/3 of body surface
Group D Healthy goats for in-contact exposure.
Group E Healthy (no skin lesion) control.
Parasitological Examination
Skin scrapings from infested WAD goats were examined for mites as previously described by Soulsby (1998). A dull scapel blade was held perpendicular to the area of affected skin and used with moderate pressure to scrape the edges of lesions into a petri dish. The scraped samples were then transferred into a test-tube, and 10% KOH was added. Samples were mildly heated for 5-6 minutes until it dissolved. It was then centrifuged at 10,000g for 5 minutes. Obtained precipitates were examined under a light microscope at low and high power for presence of mites or its eggs. Positive cases were classified as clinical sarcoptic mange based on the presence of mites with long non-jointed pedicels.
Source of Mite for In-Contact Transmission Experiment
Two female goats with severe sarcoptic mange were purchased from an infested farm. The goats were used to infest healthy goats of group D by housing them together in the same pen at the animal house as described by Elbers et al. (2000) and Tarigan (2002).
Sample Collection
Blood sample (5ml) was collected from each of the goats in groups A to E at the beginning of the experiment (week 0) and every two weeks, via jugular venipuncture using sterile needles and syringes. In each case, 2ml of the blood sample was transferred into tubes containing EDTA for hematological analysis while the remaining 3ml was transferred into plane test tubes and allowed to clot. Supernatant sera were centrifuged at 10,000g for 10 minutes. Clean sera were extracted, stored at -200C for about 24hrs before they were used for biochemical assay.
Haematological Evaluation
The packed cell volume (PCV), total erythrocyte counts (EC), total leucocyte count (TLC), differential leucocyte counts (DLC) were determined using the method described by Coles (1986) while the haemoglobin (Hb) was determined using the Drabkin’s reagent (ICSH, 1965)
Table 1: Mean (± SEM) Packed cell volume values of WAD goats naturally infested and experimentally exposed to Sarcoptes scabiei
|
Experimental Period (weeks) |
Packed cell volume (%) |
||||
|
Group A (Mildly infested) |
Group B (Moderately infested) |
Group C(Severely infested) |
Group D (Experimentally Exposed) |
Group E (Control) |
|
|
Week 0 |
24.25±1.38bc |
22.00±1.08c |
21.50±0.65c |
26.75±1.70ab |
28.25±0.85a |
|
Week 2 |
25.50±0.87a |
21.75±0.63b |
20.75±0.48b |
26.50±1.55a |
28.25±0.85a |
|
Week 4 |
22.75±1.65bc |
21.25±0.85c |
20.00±1.22c |
25.00±1.41ab |
28.00±0.41a |
|
Week 6 |
23.25±1.11b |
22.00±1.08bc |
19.25±0.85c |
25.00±1.44b |
28.50±0.66a |
Values on the same row with different super scripts are significantly (p < 0.05) different
Table 2: Mean (± SEM) haemoglobin concentration of WAD goats naturally infested and experimentally exposed to Sarcoptes scabiei
|
Experimental period (weeks) |
Haemoglobin concentration (g/dl) |
||||
|
Group A (Mildly infested) |
Group B (Moderately infested) |
Group C (Severely infested) |
Group D (Experimentally Exposed) |
Group E (Control) |
|
|
Week 0 |
9.65±0.53abc |
8.15±0.47c |
8.60±0.43ac |
9.25±0.70ac |
10.05±0.36ab |
|
Week 2 |
9.18±0.38ab |
7.75±0.36b |
8.10±0.55b |
8.95±0.63ab |
9.85±0.40a |
|
Week 4 |
8.35±0.43ab |
7.50±0.54b |
8.53±0.66ab |
8.83±0.61ab |
9.88±0.38a |
|
Week 6 |
7.35±0.50bc |
8.15±047bc |
6.85±0.25b |
8.55±0.67ac |
10.03±0.64a |
Values on the same row with different superscripts are significantly (p < 0.05) different
assay method for Hb concentration. The erythrocytic indices such as the mean corpuscular volumes (MCV), mean corpuscular haemoglobin (MCH), and mean corpuscular haemoglobin concentration (MCHC) were calculated based on the earlier laboratory assay results of PCV, Hb concentration, and EC (Coles, 1986).
Serum Biochemical Assay
The determination of Total Serum Protein was carried out using the direct biuret method as described by Lubran (1978) for the in vitro determination of total protein in serum or plasma.
Determination of serum albumin was carried out using the Bromocresol green method as described by Doumas et al. (1971) while serum creatinine was based on the modified Jaffe method (Blass et al, 1974) for the in vitro determination of creatinine in serum, plasma or urine, using the Quimica Clinica Applicada (QCA) Creatinine test kit (QCA, Spain).
Data Analysis
Data obtained were subjected to analysis of variance (ANOVA) and variant means were separated by the least significant difference (LSD) method, using SPSS statistical package. Significant differences were accepted at p < 0.05 probability level.
RESULTS
Packed Cell Volume, PCV (%)
The mean (± SE) PCV (%) for the infested groups A,B,C,D and control group E WAD goats is as presented in Table 1. At week 0, all the naturally infested groups had PCV values significantly (p < 0.05) lower than the control but groups A,B and C were not significantly (p > 0.05) different although B and C were significantly (p < 0.05) lower than group D. However, at week 2, the PCV values of groups B and C were still significantly (p < 0.05) lower than the other groups.
At week 4, the group B and C goats which were moderately to severely infested with Sarcoptes scabiei had a significantly (p < 0.05) reduced mean PCV values relative to groups D and E. At week 6, the mean PCV values of all the infested groups A, B, C and D were significantly (p < 0.05) lower than the control group E.
Haemoglobin Concentration, Hb (g/dl)
Table 2 shows the mean (± SE) haemoglobin concentration (Hb) for groups A, B, C, D and control group (E) WAD goats. At week 0 only the mean Hb values of group B was significantly (p < 0.05) lower than the control (group E). By week 2, the groups B and C Hb values were significantly (p < 0.05) lower than the control while at week 4, only the mean Hb values of group B was significantly (p < 0.05) lower than the control group E, but at week 6, the Hb values of groups A, B and C WAD goats became significantly (p < 0.05) lower than the control group E.
Erythrocyte Count, EC (x 106 µl)
Table 3 shows the mean (mean ± SE) erythrocyte count (EC) of the naturally infested groups A, B, C, the experi
Table 3: Mean (± SEM) Erythrocyte count of WAD goats naturally infested and experimentally exposed to Sarcoptes scabiei
|
Experimental period(weeks) |
Erythrocyte count (x 106 µL) |
||||
|
Group A (Mild infested) |
Group B (Moderately infested) |
Group C (Severely infested) |
Group D (ExperimentallyExposed) |
Group E (Control) |
|
|
Week 0 |
11.60±0.56ab |
10.13±0.25b |
10.05±0.44b |
11.93±0.95ab |
12.63±1.03a |
|
Week 2 |
11.05±1.06 |
10.18±0.49 |
9.95±0.46 |
12.13±0.74 |
12.08±1.05 |
|
Week 4 |
10.23±0.41ab |
10.05±0.28b |
9.88±0.46b |
11.60±0.80ab |
11.90±0.87a |
|
Week 6 |
10.40±0.35bc |
9.48±0.46b |
9.13±057b |
11.53±0.87ac |
12.53±0.77a |
Values on the same row with different superscripts are significantly (p < 0.05) different
Table 4: Mean (± SEM) Mean corpuscular volume of WAD goats naturally infested and experimentally exposed to Sarcoptes scabiei
|
Experimental period (weeks) |
Mean corpuscular volume (fl) |
||||
|
Group A (Mildly infested) |
Group B (Moderately infested) |
Group C (Severely infested) |
Group D (Experimentally Exposed) |
Group E (Control) |
|
|
Week 0 |
21.13±1.79 |
21.70±0.79 |
21.43±0.35 |
22.53±0.49 |
22.68±1.36 |
|
Week 2 |
23.43±1.33 |
21.48±0.83 |
20.98±0.91 |
21.88±0.36 |
23.88±1.99 |
|
Week 4 |
22.20±1.07 |
21.25±1.27 |
20.33±1.48 |
21.60±0.36 |
23.93±1.82 |
|
Week 6 |
22.33±0.54 |
23.23±0.28 |
21.30±1.45 |
21.80±0.84 |
22.90±0.88 |
No significant difference between the groups (p > 0.05)
Table 5: Mean (± SEM) mean corpuscular haemoglobin of WAD goats naturally infested and experimentally exposed to Sarcoptes scabiei
|
Experimental period (weeks) |
Mean corpuscular Haemoglobin (Pg) |
||||
|
Group A (Mildly infested) |
Group B (Moderately infested) |
Group C (Severely Infested) |
Group D (Experimentally Exposed) |
Group E (Control) |
|
|
Week 0 |
8.33±0.49 |
8.05±0.31 |
8.63±0.66 |
7.75±0.24 |
8.05±0.38 |
|
Week 2 |
8.43±0.57 |
7.65±0.48 |
8.25±0.84 |
7.40±0.15 |
8.28±0.40 |
|
Week 4 |
8.18±0.28 |
7.50±0.51 |
8.63±0.50 |
7.63±0.05 |
8.38±0.46 |
|
Week 6 |
7.03±0.25a |
8.60±0.18b |
7.60±0.61ab |
7.40±0.24a |
8.03±0.38ab |
Values on the same row with different superscripts are significantly (p < 0.05) different
mentally exposed group D and the control group E WAD goats. The mean EC values of groups B and C were significantly (p < 0.05) lower than the control group E at week 0. At week 2, there was no significant (p > 0.05) difference among the groups, although, the mean EC of groups A, B and C were lower than groups D and E. However, by week 4, the results were similar to what obtained at week 0. By week 6, there was a significant (p < 0.05) reduction in the mean EC values of groups B and C compared to groups D and E.
Mean Corpuscular Volume, MCV (fl)
Table 4 shows the result of the mean corpuscular volume (MCV) for all the groups. There was no significant difference between the groups throughout the period of study. However, the mean MCV values of the infested were lower than the control groups.
Mean Corpuscular Haemoglobin, MCH (pg)
The results of the mean corpuscular haemoglobin (MCH) of the experimental groups A, B, C, D and the control (E) WAD goats are presented in Table 5.There was no significant (P>0.05) variation in the mean MCH values of the experimental groups and the control WAD goats at week 0, 2, and 4. At week 6, the mean MCH of infested groups A, C and D were lower than the control except that of group B which was significantly (p < 0.05) higher than the control.
Mean Corpuscular Haemoglobin Concentration, MCHC (mg/dl)
The mean corpuscular haemoglobin concentration (MCHC) for all the five groups is as presented in Table 6. No significant (p > 0.05) change was observed at weeks 0 and 2. At week 4, a significant (p < 0.05) increase in MCHC was observed in group C compared to the other groups. However at week 6, the MCHC of group B goats became higher than the other groups (p > 0.05).
Total Leucocyte Counts, TLC (x 103 cells/µl)
The mean (± SE) TLC of the groups are presented in
Table 6: Mean (± SEM) Mean Corpuscular Haemoglobin Concentration of WAD goats naturally infested and experimentally exposed to Sarcoptes scabiei
|
Experimental period (weeks) |
Mean Corpuscular Haemoglobin Concentration (mg/dl) |
||||
|
Group A (Mildly infested) |
Group B (Moderately infested) |
Group C (Severely infested) |
Group D (Experimentally Exposed) |
Group E (Control) |
|
|
Week 0 |
40.50±3.77 |
37.50±0.65 |
40.25±2.75 |
34.50±0.65 |
35.50±0.87 |
|
Week 2 |
36.00±1.68 |
35.75±0.85 |
39.25±3.42 |
33.75±0.75 |
35.00±1.68 |
|
Week 4 |
37.25±2.56ab |
35.25±2.02a |
42.75±2.50b |
33.00±0.71a |
35.25±1.49a |
|
Week 6 |
31.50±0.87a |
37.00±0.41b |
36.25±2.90ab |
34.00±0.71ab |
35.00±1.91ab |
Values on the same row with different superscripts are significantly (p < 0.05) different
Table 7: Mean (± SEM) total leucocyte counts of WAD goats naturally infested and experimentally exposed to Sarcoptes scabiei
|
Experimental period (weeks) |
Total leucocyte counts (x 103 cells/µl ) |
||||
|
Group A (Mildly infested) |
Group B (Moderately infested) |
Group C (Severely infested) |
Group D (ExperimentallyExposed) |
Group E (Control) |
|
|
Week 0 |
13.35±1.31a |
19.63±1.14b |
17.55±0.35b |
13.88±0.66a |
13.93±0.66a |
|
Week 2 |
12.43±1.58a |
19.30±1.10b |
18.28±1.92b |
13.55±0.45a |
14.05±0.85a |
|
Week 4 |
14.38±1.09a |
20.35±1.04b |
18.35±1.10b |
14.63±0.72a |
13.75±0.75a |
|
Week 6 |
15.00±0.69ac |
19.63±1.14b |
19.98±0.40b |
17.25±0.40c |
13.85±0.99a |
Values on the same row with different superscripts are significantly (p < 0.05) different
Table 8: Mean (± SEM) Absolute Neutrophil count values of WAD goats naturally infested and experimentally exposed to Sarcoptes scabiei
|
Experimental period (weeks) |
Absolute Neutrophil count (x 103/µl) |
||||
|
Group A (Mildly infested) |
Group B (Moderately infested) |
Group C (Severely infested) |
Group D (Experimentally Exposed) |
Group E (Control) |
|
|
Week 0 |
5.73±0.65a |
9.10±0.78b |
7.55±0.54b |
5.48±0.04a |
5.23±0.36a |
|
Week 2 |
5.24±0.97a |
9.09±0.61b |
8.59±1.13b |
5.71±0.22a |
5.56±0.60a |
|
Week 4 |
6.17±0.71a |
10.02±0.65b |
8.93±0.88b |
6.40±0.61a |
5.33±0.35a |
|
Week 6 |
6.47±0.33a |
8.65±1.32ab |
10.68±1.31bc |
7.81±0.31ab |
5.42±0.59a |
Values on the same row with different superscripts are significantly (p < 0.05) different
Table 7. The mean TLC values of the WAD goats in groups B and C increased significantly (p < 0.05) relative to groups A, D and E throughout the period of study.
Absolute Neutrophil Count Values (x 103/µl)
Table 8 shows the mean absolute neutrophil count of the groups of WAD goats. At weeks 0, 2 and 4 the mean neutrophil count of groups B and C were significantly (p < 0.05) higher than the other groups.
However, at week 6, the mean values for group C was significantly higher than the other groups.
Absolute Lymphocyte Count (x 103µl)
Table 9 shows the mean (±SE) absolute lymphocyte count of the experimental groups A, B, C, D and control (E) WAD goats. The absolute lymphocyte counts of groups B and C were higher than the rest of the groups throughout the experimental period.
Absolute Monocyte Count (x 103µl)
The mean (x ± SE) absolute monocyte count of the groups is presented in Table 10. There was no significant (p > 0.05) difference among the groups at weeks 0, 2 and 4. However, by week 6, the mean monocyte count of group C WAD goats was significantly higher (p < 0.05) than the rest of the groups which were not significantly (p > 0.05) different from others.
Absolute Eosinophil Count (x 103/µl)
Table 11 shows the mean absolute eosinophil count of the experimental groups. At week 0, the mean eosinophil values of group C goats were significantly higher (p < 0.05) than groups D and E. Although the eosinophil counts of infested groups remained higher throughout the period of the experiment, it was not significant (p > 0.05 ).
Absolute Basophil Count (x 103/µl)
Table 12 shows the mean absolute basophil count of the
Table 9: Mean (± SEM) Absolute Lymphocyte count values of WAD goats naturally infested and experimentally exposed to Sarcoptes scabiei
|
Experimental period (weeks) |
Absolute Lymphocyte Count (x 103µl) |
||||
|
Group A (Mildly infested) |
Group B (Moderately infested) |
Group C (Severely infested) |
Group D (ExperimentallyExposed) |
Group E (Control) |
|
|
Week 0 |
6.77±0.62a |
9.65±0.70b |
9.05±0.67bc |
7.51±0.50ac |
8.10±0.21abc |
|
Week 2 |
7.08±0.63a |
9.90±0.74b |
9.33±0.36bc |
7.94±0.57ac |
8.30±0.38ab |
|
Week 4 |
7.73±0.59a |
9.95±0.58b |
8.48±0.28a |
7.80±0.32a |
8.00±0.42a |
|
Week 6 |
7.96±0.48a |
9.83±0.22b |
8.75±0.65ab |
8.58±0.30ab |
7.98±0.49a |
Values on the same row with different superscripts are significantly (p < 0.05) different
Table 10: Mean (± SEM) Absolute Monocyte Count values of WAD goats naturally infested and experimentally exposed to Sarcoptes scabiei
|
Experimental period (weeks) |
Absolute Monocyte Count (x 103µL) |
||||
|
Group A (Mildly infected) |
Group B (Moderately infected) |
Group C (Severely infested) |
Group D (Experimentally Exposed) |
Group E (Control) |
|
|
Week 0 |
0.20±0.04 |
0.34±0.09 |
0.23±0.9 |
0.28±0.07 |
0.29±0.07 |
|
Week 2 |
0.23±0.03 |
0.25±0.10 |
0.35±0.13 |
0.20±0.04 |
0.26±0.09 |
|
Week 4 |
0.14±0.01 |
0.15±0.05 |
0.29±0.14 |
0.25±0.11 |
0.28±0.07 |
|
Week 6 |
0.20±0.11a |
0.35±0.11a |
0.70±0.11b |
0.39±0.10a |
0.27±0.05a |
Values on the same row with different superscripts are significantly (p < 0.05) different
Table 11: Mean (± SEM) Absolute Eosinophil Count values of WAD goats naturally infested and experimentally exposed to Sarcoptes scabiei
|
Experimental period (weeks) |
Absolute Eosinophil Count (x 103/µl) |
||||
|
Group A (Mildly infected) |
Group B (Moderately infected) |
Group C (Severely infested) |
Group D (Experimentally Exposed) |
Group E (Control) |
|
|
Week 0 |
0.31±0.06ab |
0.29±0.04ab |
0.40±0.11b |
0.18±0.04a |
0.11±0.07a |
|
Week 2 |
0.18±0.05 |
0.29±0.06 |
0.29±0.08 |
0.14±0.05 |
0.14±0.05 |
|
Week 4 |
0.29±0.07 |
0.30±0.05 |
0.24±0.06 |
0.17±0.07 |
0.14±0.06 |
|
Week 6 |
0.30±0.07 |
0.29±0.06 |
0.35±0.16 |
0.43±0.06 |
0.19±0.07 |
Values on the same row with different superscripts are significantly (p < 0.05) different
Table 12: Mean (± SEM) Absolute Basophil Count values of WAD goats naturally infested and experimentally exposed to Sarcoptes scabiei
|
Experimental period (weeks) |
Absolute Basophil count (x 103/µl) |
||||
|
Group A (mildly infested) |
Group B (moderately infested) |
Group C (Severely infested ) |
Group D (Experimentally Exposed) |
Group E (Control) |
|
|
Week 0 |
0.04±0.04 |
0.00±0.00 |
0.05±0.05 |
0.00±0.00 |
0.00±0.00 |
|
Week 2 |
0.00±0.00 |
0.00±0.00 |
0.00±0.00 |
0.00±0.00 |
0.00±0.00 |
|
Week 4 |
0.04±0.04 |
0.00±0.00 |
0.00±0.00 |
0.00±0.00 |
0.00±0.00 |
|
Week 6 |
0.04±0.04 |
0.00±0.00 |
0.00±0.00 |
0.04±0.04 |
0.00±0.00 |
No significant difference between the groups (p > 0.05)
five groups of WAD goats. All through the period of the study, there was no significant (p > 0.05) difference or variation in the mean absolute basophil count values of the five experimental groups.
Serum Biochemical Assay
Statistical analysis showed that the mean total protein was lower in the severely infested group C (p > 0.05) compared to the rest of the groups while the mean total protein of mildly infested WAD goats of group A was higher than the rest of the groups (p > 0.05). There was also no significant variation in the mean total protein of the exposed group D (p > 0.05).
There was no significant variation in mean albumin, globulin and creatinine levels among the groups (p > 0.05). However, the mean albumin level was lower in the moderate and severely infested group C (p > 0.05) while the level of creatinine was higher in the severely infested group C (p > 0.05) (Figure 1 and 2).
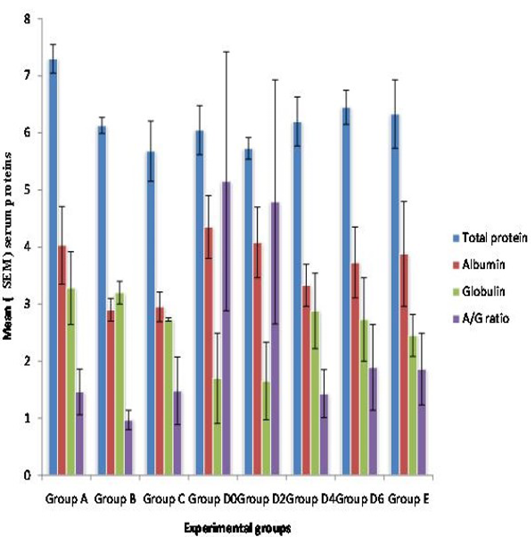
Figure 1: Mean (+ SEM) Seurm protiens in WAD goats naturally and experimently infested with Sarcoptes scabiei
Group A) Mildly infested; Group B) Moderatly infested; Group C) Severly infested; Group D) Experimently exposed (Week 0-D0, Week 2-D2, Week 4-D4, Week 6-D6); Group E) Control
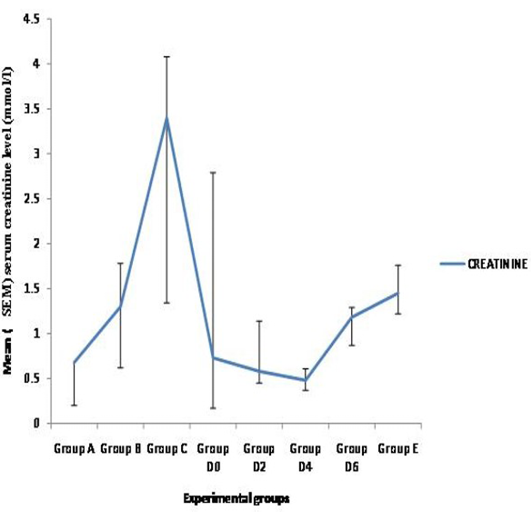
Figure 2: Mean (+ SEM) Seurm Creatinine in WAD goats naturally and experimently infested with Sarcoptes scabiei
Group A) Mildly infested; Group B) Moderatly infested; Group C) Severly infested; Group D) Experimently exposed (Week 0-D0, Week 2-D2, Week 4-D4, Week 6-D6); Group E) Control
DISCUSSION AND CONCLUSION
The marked reduction in PCV, Hb and EC values seen in the naturally infested goats of group A, B and C throughout the period of study and in group D by the 6th week of the study compared to the control, shows that mange is associated with anaemia at later stages of infestation. Similar results have also been reported in rabbits and dogs with severe and short term advanced sarcoptic mange (Arlian et al., 1988a, 1995), experimental sarcoptic mange in camels (Parmar et al., 2005), sheep (Hafeez et al., 2007) and goats (Ujjwal and Dey, 2010), even though they did not relate such changes in erythrocytic indices to the severity of mange. However, this result is in contrast to that of Chineme et al. (1979) who observed no change in the blood of sheep suffering from sarcoptic mange. It could be that the sheep they studied were under one form of supplementation or the other during the course of the disease since this was not highlighted in the case report. The increase in TLC which was accompanied by a significant (p < 0.05) increase in both the neutrophil and lymphocyte counts in groups B and C compared to groups A and E, is indicative of a systemic inflammatory status in mange infestation. This could be due to invasion of bacteria from cutaneous lesions or immunomodulatory activity of mange products. However, the increased monocyte count in group C at week 6 may be due to increased need for phagocytosis of dead cellular debris in the severely affected animals. The increase in eosinophil counts of infested groups A, B and C compared to the control as observed in this study has been reported in sarcoptic mange infested wombats (Skerrat et al., 1999), red foxes (Little et al., 1998), raccoon dogs (Kido et al., 2011) and dogs (Arlian et al., 1995). This increase might have been induced by parasites in the skin as eosinophils are known to be the common cellular response in many parasitic infestations. It is also an indication of type I hypersensitivity reaction.
The marked reduction in total protein values of the severely infested group C goats compared to the rest has also been reported (Kido et al., 2011). This was attributed to malnutrition usually associated with debilitated sarcoptic mange infested animals. The observation was further substantiated from necropsy findings in most of the animals in group C in which there was serous atrophy of the pericardial and subcutaneous fats. The mean albumin and globulin values decreased with increasing severity of infestation. The reductions could also be due to loss of plasma proteins from the exudative dermatitis as has been previously reported (Pence et al., 1983; Kamboj, 1991; Dadlich and Khanna, 2008).The A/G ratio was not clinically significant except that of the moderately infested group B which was less than 1 and might be attributed to malnutrition. The high creatinine concentration observed in the severely infested group C WAD goats could be due to glomerulonephritis usually associated with complicated sarcoptic mange infestation (Svartman, et al., 1972; Burgess, 1994; Nakagawa, 2009; Kido et al., 2011) or false elevations resulting from non-creatinine chromogens such as acetoacetic acid (Ketone body) due to chronic malnutrition or debilitation. This study has shown that sarcoptic mange can induce abnormal hematological and biochemical changes based on the severity of disease which is also dependent on duration of infestation.
ACKNOWLEGEMENT
We wish to acknowledge the laboratory staff of the Department of Veterinary Pathology and Microbiology for their technical support.
CONFLICT OF INTEREST
The authors declare that there is no conflict of interest.
Author’s Contribution
Remigius Ibe Onoja conceived and carried out the research and wrote the manuscript while Shodeinde Vincent Olumuyiwa Shoyinka supervised the work, edited and wrote part of the manuscritpt.
REFERENCES


