The Journal of Advances in Parasitology
Research Article
J. Adv. Parasitol. 8(2): 20-25
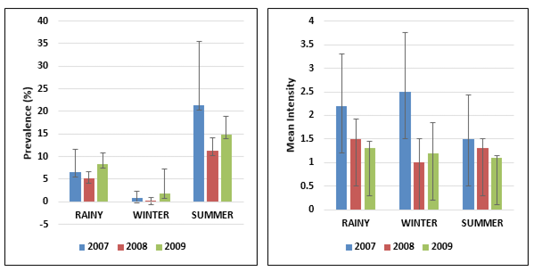
Figure 1
Error bars represent the standard deviation of the Prevalence and Mean Intensity of infection season wise from 2007-2009
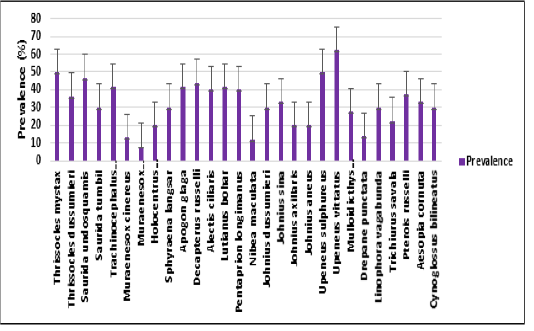
Figure 2
Error bars represent the standard deviation of the prevalence of infection in each fish species in a total period of 3 years 2007 to 2009
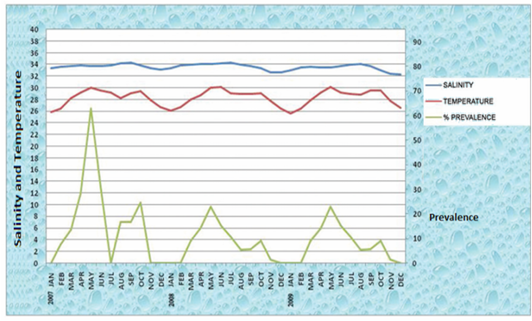
Figure 3
Comparison of Salinity, Temperature with Prevalence of infection in a total period of 3 years 2007-2009


