The Journal of Advances in Parasitology
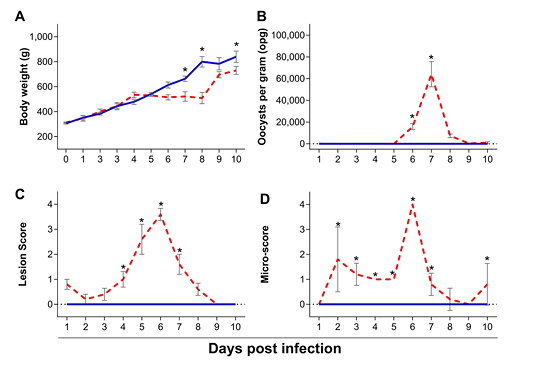
Body weight (A), oocyst shedding (B), lesion scores (C) and microscopic scores (D) of chickens infected with Eimeria maxima (red dashed line) as compared to uninfected chickens (blue solid line), assessed from 1 to 10 days post infection (dpi). Standard error means (SEM) are depicted by vertical lines. Two-way-ANOVA test was performed at 5% level of significance (p < 0.05), with multiple comparisons corrected by Bonferroni’s method. Significant differences between the groups are indicated by the superscript asterisk.
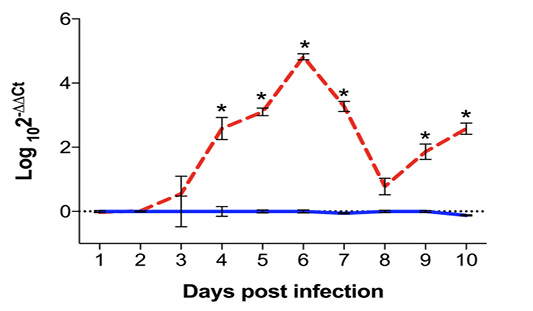
Quantification of Eimeria maxima DNA in ileum samples of infected (red dashed line) and uninfected (blue solid line) chickens, assessed by qPCR from 1 to 10 days post infection (dpi) and expressed as Log102-∆∆Ct. Standard error means (SEM) are depicted by vertical lines. Two-way-ANOVA test was performed at 5% level of significance (p < 0.05), with multiple comparisons corrected by Bonferroni’s method. Significant differences between the groups are indicated by the superscript asterisk.
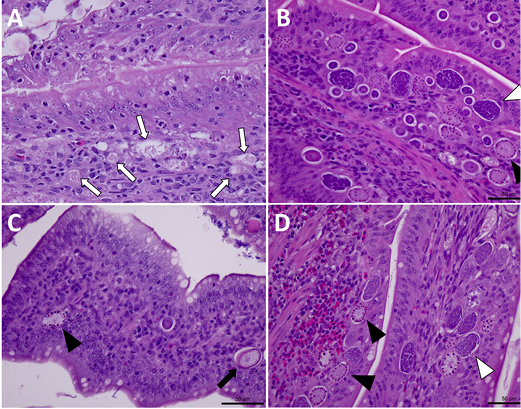
Detection of E. maxima in histological samples of intestinal sections. (A) visualization of schizonts (white arrows) at 4 dpi, 200x. (B) Visualization of macrogametocytes (black arrowheads) and microgametocytes (white arrowheads) at 5 dpi, 400x. (C) Visualization of macrogametocyte (black arrowhead) and immature oocyst (black arrow) at 6 dpi, 400x. (D) Visualization of macrogametocytes (black arrowheads) and microgametocytes (white arrowheads) at 7 dpi, 400x). Tissues were stained with hematoxylin and eosin (H&E), slides analyzed by optical microscopy.
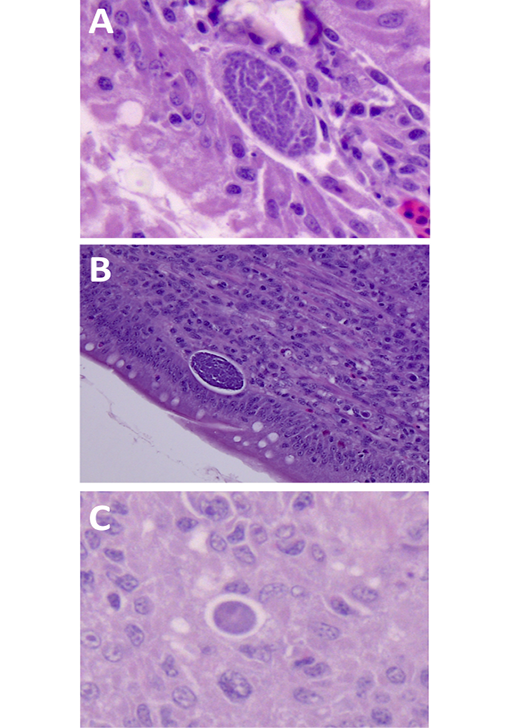
Detection of E. maxima in histological samples of intestinal sections. (A) visualization of microgametocyte at 8 dpi, 630x. (B) Visualization of microgametocyte at 9 dpi, 400x. (C) Visualization of macrogametocyte immature macrogametocyte at 10 dpi, 630x. (D) Tissues were stained with hematoxylin and eosin (H&E), slides analyzed by optical microscopy.
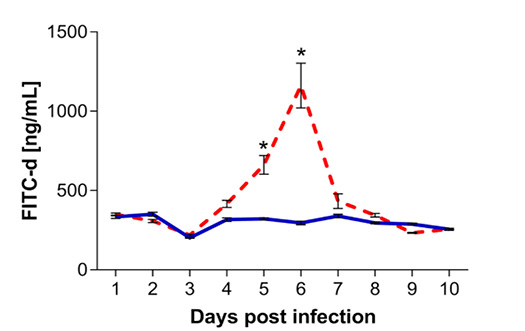
Quantification of fluorescein isothiocyanate dextran (FITC-d) in serum samples collected from chickens infected with Eimeria maxima (red dashed line) as compared to uninfected chickens (blue solid line). Presence of FITC-d was assessed by ELISA from 1 to 10 days post infection (dpi). Standard error means (SEM) are depicted by vertical lines. Two-way-ANOVA test was performed at 5% level of significance (p < 0.05), with multiple comparisons corrected by Bonferroni’s method. Significant differences between the groups are indicated by the superscript asterisk.
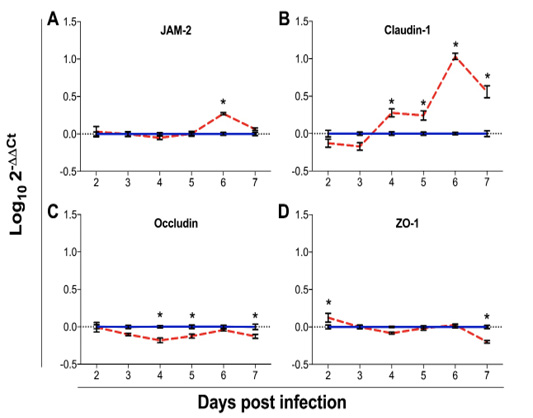
Gene expression analysis of the tight junction genes: junction adhesion molecule 2 (JAM-2; A), claudin 1 (B), occludin (C) and Zona occludens 1 (ZO-1; D) in chickens infected with Eimeria maxima (red dashed line) as compared to uninfected chickens (blue solid line). Data were assessed from 2 to 7 days post infection (dpi). Expression of mRNA was done by qPCR, with results expressed as Log102-∆∆Ct. Standard error means (SEM) are depicted by vertical lines. Two-way-ANOVA test was performed at 5% level of significance (p < 0.05), with multiple comparisons corrected by Bonferroni’s method. Significant differences between the groups are indicated by the superscript asterisk.


