Advances in Animal and Veterinary Sciences
Research Article

Effect of Decreasing the Maize Content of Feed on Growth Performance, Rumen pH, and Blood Chemistry in Grain-Fed Holstein Bull Calves
Yassin Najid1, Yvon Couture2, Sonia Chénier3, Alain Fournier4, Dany Cinq-Mars5, Younès Chorfi1, 6
1Département de Biomédecine Vétérinaire, Faculté de médecine vétérinaire - Université de Montréal, 3200 Sicotte St., P.O. Box 5000, Saint-Hyacinthe, QC, J2S 7C6, Canada; 2Département de Sciences cliniques – Université de Montréal; 3Département de pathologie et microbiologie - Université de Montréal; 4Ministère d’Agriculture, Pêcheries et Alimentation du Québec, 460 Boulevard Louis-Fréchette Nicolet J3T 1Y2, Canada; 5Département des Sciences Animales, Université Laval, 2425 Rue de l’agriculture Québec, QC, G1V 0A6, Canada.
Abstract | The aim of the study was to evaluate the impact of replacing the maize portion of the diet on growth, rumen health and blood chemistry of Holstein bull calves. A maize plus protein supplement feed (MS), a MS plus corn distiller’s dried grain with soluble matter (DDGS) feed (MSD), a maize plus canola meal plus DDGS feed (MCD), a barley plus canola meal plus DDGS feed (BCD), and a hay grass negative control feed (N) were all given ad libitum. Three-month-old bull calves were assigned randomly to MS, MSD, MCD and BCD, 80 animals per treatment, 10 per pen. An additional group of five bull calves were assigned to N. Blood HCO3-, anion gap, urea, glucose, pH, PCO2,L-lactate and lipopolysaccharide binding protein were measured. Daily duration below pH 5.6 (DpH5.6)in the rumen was logged. A mixed linear model (Proc Mixed) was used for data collected over time from individual animals. Histology results and liver rejections were analysed using a chi-square test (Proc Freq), and linear regressions to evaluate the relationships between DpH5.6 and ADG.MSD and MCD produced similar growth but did not decrease DpH5.6 or affect blood parameters. BCD decreased DpH5.6 and improved gain at the finishing phase but did not affect blood parameters. Diets had no effect on rumen epithelium and lamina propria, or on the frequency of liver abscesses. Partial or total replacement of maize by DDGS, barley and canola meal appears not to affect livestock performance.
Keywords | Rumen, Growth, Blood parameters, Grain-fed bull calves, Maize
Editor | Kuldeep Dhama, Indian Veterinary Research Institute, Uttar Pradesh, India.
Received | June 02, 2017; Accepted | August 13, 2017; Published | October 08, 2017
*Correspondence | Yonus Chorfi, Département de Biomédecine Vétérinaire, Faculté de médecine vétérinaire - Université de Montréal, 3200 Sicotte St., P.O. Box 5000, Saint-Hyacinthe, QC, J2S 7C6, Canada; Email: dany.cinq-mars@fsaa.ulaval.ca
Citation | Najid Y, Couture Y, Chenier S, Fournier A, Cinq-Mars D, Chorfi Y (2017). Effect of decreasing the maize content of feed on growth performance, rumen ph, and blood chemistry in grain-fed holstein bull calves. Adv. Anim. Vet. Sci. 5(10): 425-435.
DOI | http://dx.doi.org/10.17582/journal.aavs/2017/5.10.425.435
ISSN (Online) | 2307-8316; ISSN (Print) | 2309-3331
Copyright © 2017 Najid et al. This is an open access article distributed under the Creative Commons Attribution License, which permits unrestricted use, distribution, and reproduction in any medium, provided the original work is properly cited.
Introduction
Maize is the main cereal crop used to make feed for grain-fed calves (FPBQ, 2013). Most of the dry matter of maize is starch (Loerch and Gorocica-Buenfil, 2008), as much as 73% (McDonald et al., 2011). In cattle, a diet that is too rich in starch, or factors that cause the starch to break down too quickly in the rumen, can cause rumen acidosis and lead to increased morbidity (González et al., 2012; Berry et al., 2004). In their review, Krause and Oetzel (2006) reported that subacute ruminal acidosis (SARA) is generally observed in animals when rumen pH is below 5.6, more precisely between 5.0 and 5.5 and acute ruminal acidosis when it goes below 5.0, with often fatal consequences for the animal. According to these researchers, SARA is seen more frequently in dairy cows between 0 and 5 months post calving and in feedlot cattle fed high concentrate diets.
The starch contents of maize, rolled barley, corn distiller’s dried grain with soluble matter (DDGS) and canola meal are respectively 72 %, 57 %, 3.9 % and 2–3 % (NRC, 2001).Compared to whole barley, maize has been found to improve growth performance and feed digestibility in grain-fed calves (Noon et al., 1998; Ham et al., 1994) found that replacing dry-rolled maize with up to 40 % DDGS reduced acidosis and improved growth performance in steers. Similar results were found by Buckner et al. (2007), who obtained the greatest improvement when dry-rolled maize was replaced with 20 % DDGS in comparison with rolled barley and canola meal. Salim (2011) reported that inclusion of DDGS in the feed did not affect the final body weight (BW), average daily gain (ADG), number of days of feeding, rumen pH, or carcass characteristics of the steers. However, liver abscess scores were 50% lower compared to steers raised on the regular maize feed.
In the past decade, maize prices increased by almost 75%, reaching $259.00/t in 2013 (Grainwiz, 2013). Finding alternative feedstuffs for raising grain-fed cattle would also help alleviate high feed costs. The aim of this study was therefore to evaluate the effects of partial or total replacement of maize by DDGS, canola meal and rolled barley on growth performance, rumen pH, and blood biochemical parameters in grain-fed bull calves. The hypothesis tested was that replacing maize with these substitutes in an iso-nitrogenous diet does not reduce growth and has a positive impact on rumen pH, blood biochemical parameters and the frequency of liver abscesses in these animals.
Materials and Methods
Animals
Healthy Holstein bull calves of similar body weight (117±13 kg) aged 3 months were used for this experiment. The animals were housed in a well-ventilated, slatted-floor barn divided into 32 pens equipped with automatic watering devices. The pens (7m x 3.66 m with 0.37 m of feeder per animal) were assigned randomly to four experimental diets. Ten calves were assigned to each pen and an additional five calves served as negative control animals. Relative humidity and temperature were automatically recorded every 5 minutes and the lighting regime was8L:16D. The incidence of diseases was monitored and veterinary interventions were recorded. Canadian Council on Animal Care guidelines (CCAC, 1993) were followed and the protocol received approval from the animal care committee of the Université de Montréal Faculté de médecine vétérinaire.
Diet and Livestock Performance
For the first two weeks, the calves were fed an adaptation diet consisting of whole maize, rolled barley, DDGS, canola meal, minerals, vitamins, trace minerals, 50 g of electro lytesper day per calf (Electrolyte plus™, Vétoquinol N.-A. Inc. Lavaltrie, Qc, Canada) and 22 mg of antibiotic (Oxytetracycline HCl Soluble Powder, Bio Agri Mix LP, Mitchell, ON, Canada) per dayper kg BW. The five experimental diets were as follows: a positive control feed (MS) containing maize plus amaize-free protein supplement (DeliPro, COMAX, St-Hyac in the, Qc, Canada)to provide 18% crude protein; MS in which a portion was replaced with DDGS (MSD); a diet in which a portion of the maize and all of the protein supplement were replaced with DDGS and canola meal (MCD); a diet consisting of rolled barley, canola meal and DDGS (BCD) and a negative control diet consisting of haylage (12.2% crude protein, 55.7% neutral detergent fibre, 33.2% acid detergent fibre, 0.28% calcium, 0.34% phosphorus, 3.01 % K, and 0.02% Na and 9.8 % moisture) along with 0.7kg of MS given twice daily (N). Access to feed was ad libitum in all groups. Each calf also received daily 200 gof a vitamin-mineral-antibiotic supplement (mineral pre-mix for heavy calves, COMAX, St-Romuald, Qc, Canada) containing (in%): Ca 22.0, P 0.10, Na 6.25, K 1.90, Mg 0.41, S 0.15, (in mg/kg): Mn 905, Fe 700, sodium monensin 600, Se 5.50, Cu 210, Co 8.0, Zn 1.065, I 18.5, F 45, (in IU/kg): vitamin A 135,600, Vitamin D-3 35,900, Vitamin E 700.The composition of each diet for the three phases is listed in Table 1.The starting phase corresponded to days0–54, the growing phase to days 55–85, and finishing phase to days 86–96.The MS, MSD,MCD and BCD diets were distributed at 06h00, 10h30, 15h00 and 20h30. Feed left in the feeder was weighed and analysed (crude protein, acid and neutral fibre, fat, minerals and starch) twice a week (Megazyme International Ireland, Wicklow, Ireland).
Each calf was weighed (full body weight) on days 0, 27, 54, 85 and 96 using a digital control scale (P.F.P Equipementsinc., Qc, Canada) recalibrated after every 100 measurements. BW was determined using the average of two measurements made on two consecutive days. Carcass yield was calculated as percent warm carcass weight (without hide and viscera) relative to live body weight.
Biochemical Analysis
Two calves per pen (14 calves/treatment) were selected for blood analysis. Samples were collected from the jugular vein in heparinized tubes on days 0, 68, 85, and 96 and analysed without delay for Na+, K+, bicarbonate (HCO3-), Cl-, anion gap, blood urea, glucose, pH, and CO2 pressure (PCO2) using a portable VetScan i-STAT1 analyzer with an i-STAT EC8+ cartridge (Abaxis, CA, USA). Blood L-lactate was determined using a portable Lactate Pro™ LT-1710 device with Lactate Pro test strips (ArkayInc, Japan). Individual samples were centrifuged and plasma was stored at -80 °C for lipopolysaccharide binding protein (LBP) analysis using an ELISA kit (Enzo Life Sciences, Inc. NY, USA).
Rumen pH Measurement
Rumen pH was measured using a data logger (Dascor model T9 with SRpH-102 pH sensor, Escondido, Ca, USA) of 20.7 mm in diameter, 140 mm long and weighing 230 g, inserted orally into the saccus ventral is using a flexible white PVC tube (152 cm long, 33 mm outer diameter, 26 mm inner diameter). A metal detector was used to confirm that the logger had reached the bottom of the rumen. Rumen pH was logged continuously every 5 min from day 68 to 96. The data loggers were retrieved at the end of the experiment, and mV were converted to pH using pre and post-use calibrations made in pH 4 and 7 buffers solutions at 38°C.The loggers communicate via a USB serial cable with the PC-supported application software (Dascor Data Logger Software M5 v7.7.0) for analysis. Rumen pH was monitored in 7 calves per treatment and in all N calves.
The daily average duration below the threshold value of pH 5.6 (DpH5.6 in h d-1) was used as the criterion for ruminal acidos is, as described previously (Aikman et al., 2011; Bevans et al., 2005).
Rumen and Liver Tissue Collections
Animals were slaughtered and eviscerated according to standard abattoir procedures. Samples (3 cm x 3cm) were promptly excised from the atrium (1 sample from the pillar and 1 from the base) and rumen (1 sample from cranial pillar and 1 from ventral sac) of calves that had received data loggers. Collected tissues were fixed in 10% neutral buffered formalin, processed routinely, and sections (5 µm thick) were stained with hematoxylin, phloxin, eosin and saffron (HPES). The degree of inflammation in the lamina propria was evaluated semi-quantitatively and graded as none, slight, positive or severe and the distribution noted as multifocal or diffuse. The epithelium was also examined for signs of damage. Parakeratosis was graded as none, positive or severe, multifocal or diffuse and the presence of pustules and/or mineralization was also noted. Three classes of severity of inflammation, damage to the epithelium and lamina propria, and parakeratosis were established: none or mild, moderate, and severe. Livers rejected at the slaughter house because of abscesses were noted.
Statistical analysis
Statistical analyses were carried out using SAS v.9.4 (Cary, NC, USA). For data collected over time from individual animals (e.g. BW, LBP and biochemical parameters), a mixed linear model (Proc Mixed) was used including two random factors (pen nested within diet and ID nested within the pen) and diet, time, and the interaction between diet and time as fixed factors. A priori contrasts were made between pairs of treatment means for different time periods, adjusting alpha values for each contrast with the Bonferroni sequential adjustment procedure for multiple comparisons. LBP data were log10-transformed to normalize the distribution. For carcass yield (a single measurement), the mixed linear model included a single random factor, namely pen nested within diet. For data collected at the pen level across time (e.g. dry matter intake (DMI), starch and NDF intake), a mixed linear model was used including pen nested within treatment as a random factor, and diet, time and the diet x time interaction as fixed factors. DpH5.6 was analysed using a linear model with diets as a fixed factor. A post-hoc Tukey-Kramer test was used to compare treatments between phases. Histology results and liver rejections were analysed using a chi-square test (Proc Freq). Linear regressions were used to evaluate the relationships between DpH5.6 and ADG.
Results
Livestock Performance
The experimental diets had no significant effect on calf weight (Table 2) or G/F ratio (Figure 1) or on ADG for days 0–27, days 28–54, or days 55–85.However, the ADG for days 86–96 was greater (P< 0.001) for animals fed the BCD diet (Figure 2). The ADG appeared to decrease during days 55–85, possibly because of high ambient temperatures and relative humidity (data not shown). Dry matter intake during days 86–96 was significantly lower among calves fed MSD than among those fed MS or BCD (Table 3). Ingested starch was greater among calves fed the MS diet than among the other animals (P<0.001) throughout the experiment; while ingested NDF was lower (P< 0.004).Animals in pens fed BCD diet ingested more NDF than those fed MSD or MCD (P<0.0001). Mean carcass yield (Figure 3) was lower among calves fed the BCD diet than those fed MS or MSD (P<0.002).
Rumen pH
During both the growing and finishing phases, the DpH5.6 among calves fed the maize-based diets was significantly higher (P< 0.001) than it was among those fed BCD (Figure 4). Furthermore, there was a significant difference between these phases. Finishing-phase calves had on average a higher DpH5.6 than did growing-phase calves. The ADG and DpH5.6 during these phases are shown in Figure 5.The Pearson’s coefficients of determination were r2 = 0.03 and r2 = 0.13, while the slopes (b1) did not deviate from 0, with P=0.43 and P=0.08 respectively for growing and finishing calves, showing that there was no relationship between these variables.
Biochemical Analysis
Even though the initial (day 0) blood L-lactate concentrations differed among the treatment groups, they were not significantly different (P> 0.05) on days 68, 85 and 96 (Table 4).

Figure 1: Ratio of body weight gain to feed intake (G/F ratiomean ± SD) for Holstein bull calves raised on experimental diets for 96 days (See Table 1 for composition.)
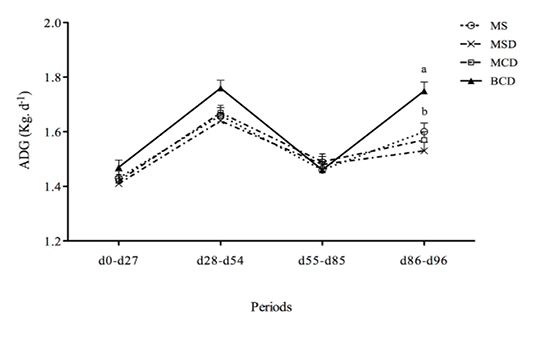
Figure 2 Average daily gain (ADG)(mean ±SEM)of Holstein bull calves raised on experimental diets for 96 days (See Table 1 for composition.)
Differing lower-case lettersdenote intra-period significant difference(p<0.05)
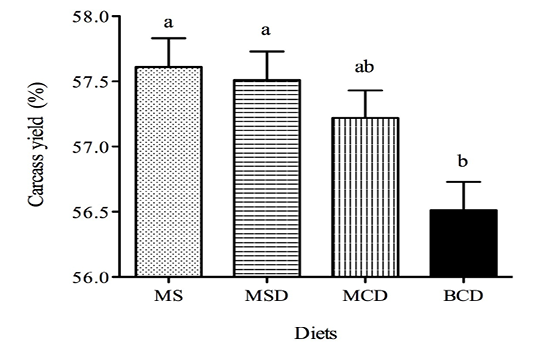
Figure 3 Carcass yield (mean ±SEM) of Holstein bull calves raised on experimental diets for 96 days (See Table 1 for composition.)
Differing lower-case lettersdenote significant difference (p<0.05)

Figure 4 Daily average duration (mean ± SEM) of pH below 5.6(DpH5.6) in the rumen of Holstein bull calves raised on experimental diets for 96 days (See Table 1 for composition) DpH5.6 was calculated from direct pH measurement logged every 5 min. Differing lower-case lettersdenote significant difference within the same period (p<0.05). Asterisk indicates significant difference between phases for each treatment(p<0.05).
Blood pH on day 0 was higher (P< 0.0001) in the negative control group (N) than among calves fed the other experimental diets, but was similar for all treatments on days 68, 85 and 96.
Blood PCO2 measurements were similar on days 68 and 96 among the groups. However, it was lower in the case of group N than in the other groups on days 0 and 85 (P = 0.0001; P = 0.0003 compared to group MS).
The treatments had no significant effects on blood HCO3- measured on days 0, 85 or 96. However, HCO3- was found higher in N than in MCD on day 68 (P = 0.0008). No significant treatment effect on anion gapwas observed for any sampling date.
No significant effect on blood urea was observed for days 85 or 96. However, the mean blood urea of group N group on day 0 was lower than for the other groups (P< 0.0001).On day 68, blood urea was lower for N than for the MS, MSD and BCD groups (P< 0.001) and similar to that of MCD. Blood glucose concentrations were similar in groups MS, MSD, MCD and BCD on all sampling dates. Group N blood glucose on days 0 and 68 was lower (P< 0.0001), similar to group BCD on day 85 and lower than group MS on day 96.
Both diet and time affected blood LBP levels in the calves. The concentrations were higher on days 68 and 96 than on day 0. There was no significant difference between treat
Table 1: Composition ofthe experimentaldiets used during the three phases of thetrial.
| Feed | MS | MSD | MCD | BCD | ||||||||
|
Phase1 |
1 | 2 |
3 |
1 | 2 |
3 |
1 | 2 |
3 |
1 | 2 | 3 |
|
Ingredients (% as fed) |
||||||||||||
| Maize | 70 | 73 |
78 |
61 | 63 |
68 |
57 | 61 |
65 |
- | - | - |
|
Protein supplement2 |
30 | 27 |
22 |
18 | 16 |
11 |
- | - |
- |
- | - | - |
|
Rolled barley |
- | - |
- |
- | - |
- |
- | - |
- |
64 | 68 | 74 |
|
Canola meal |
- | - |
- |
- | - |
- |
22 | 19 |
14 |
15 | 11 | 5 |
|
DDGS3 Mineral4 |
- | - | - | 21 | 21 | 21 | 21 | 20 | 21 | 21 | 21 | 21 |
| Nutrient analysis (% mass) | ||||||||||||
| Total digestible | 83.4 | 85.4 |
86.0 |
84.5 | 85.4 |
86.2 |
82.3 | 84.6 |
85.6 |
80.1 | 82.1 | 83.0 |
|
Dry matter |
89.05 | 89.03 |
88.99 |
89.20 | 89.17 |
89.15 |
89.19 | 89.17 |
89.14 |
88.59 | 88.53 | 88.44 |
|
Crude protein |
18.60 | 15.79 |
15.74 |
18.98 | 17.87 |
16.59 |
18.82 | 18.11 |
16.32 |
19.77 | 18.75 | 17.23 |
|
NDF |
16.82 | 16.12 |
14.96 |
22.83 | 21.81 |
21.16 |
22.39 | 21.93 |
20.77 |
27.59 | 27.14 | 26.47 |
|
ADF |
8.86 | 8.40 |
7.62 |
11.69 | 10.98 |
10.24 |
10.50 | 10.19 |
9.41 |
12.57 | 11.98 | 11.09 |
|
Starch |
49.12 | 51.00 |
54.14 |
39.22 | 41.90 |
44.57 |
42.63 | 43.89 |
47.02 |
33.78 | 35.83 | 38.89 |
|
Lignin |
3.24 | 3.07 |
2.78 |
4.08 | 3.82 |
3.51 |
3.56 | 3.44 |
3.16 |
3.61 | 3.32 | 2.90 |
|
Fat |
3.50 | 3.50 |
3.49 |
5.03 | 4.97 |
5.07 |
5.14 | 5.14 |
5.14 |
3.95 | 3.90 |
3.82 |
| Calcium | 0.14 | 0.12 |
0.10 |
0.17 | 0.15 |
0.11 |
0.08 | 0.07 |
0.05 |
0.16 | 0.13 | 0.09 |
|
Phosphorus |
0.54 | 0.51 |
0.47 |
0.59 | 0.56 |
0.53 |
0.56 | 0.55 |
0.50 |
0.61 | 0.58 | 0.54 |
|
Potassium |
0.68 | 0.65 |
0.59 |
0.75 | 0.71 |
0.67 |
0.73 | 0.70 |
0.65 |
0.80 | 0.77 | 0.72 |
|
Magnesium |
0.25 | 0.24 |
0.21 |
0.26 | 0.25 |
0.23 |
0.24 | 0.23 |
0.21 |
0.25 | 0.23 | 0.21 |
|
Sodium |
0.03 | 0.02 |
0.02 |
0.05 | 0.05 |
0.05 |
0.05 | 0.05 |
0.05 |
0.05 | 0.05 | 0.05 |
|
Sulphur |
0.25 | 0.24 |
0.22 |
0.37 | 0.34 |
0.31 |
0.30 | 0.29 |
0.27 |
0.36 | 0.33 |
0.30 |
1Phase 1: days 0–54 (starting), Phase 2 (growing): days 55–85, Phase 3(finishing): days 86–96; 2Protein supplement(DeliPro):crude protein 43.6%, fat2%, NDF 10%, calcium 3.5%, phosphorus 0.8%, sodium 1.3%, magnesium 0.55%, potassium 1.3%, sulphur 0.6 %, iodine 7 ppm, copper 50 ppm, manganese 220 ppm, zinc 300 ppm,selenium 1.28 ppm, cobalt 2.4 ppm,fluorine 60 ppm, vitamin A 31,700 IU/kg,vitamin D-3 8400 IU/kg,vitaminE130 IU/kg; 3DDGS:corn distillers’ dried grain with soluble matter; 4Each calf received200 g of mineral-vitamin-antibiotic supplement per day (see Materials and Methods).
Table 2: Effects of experimental diets on the body weightof grain-fed Holstein bull calves.
| Feed | ||||||
| Day | MS (n=77) | MSD (n=77) | MCD (n=80) |
BCD (n=77) |
P | |
|
0 |
117.5 ± 0.16 | 117.85 ± 0.16 | 117.07 ± 0.15 |
117.57 ± 0.15 |
0.58 | |
|
27 |
157.81 ± 0.21 | 157.8 ± 0.21 | 157.4 ± 0.20 |
157.67 ± 0.20 |
0.43 | |
|
54 |
204.66 ± 0.26 | 204.8 ± 0.26 | 204.2 ± 0.24 |
205.76 ± 0.26 |
0.05 | |
|
85 |
245.85 ± 0.30 | 245.8 ± 0.30 | 245.8 ± 0.28 |
245.62 ± 0.29 |
0.07 | |
|
96 |
266.99 ± 0.31 | 266.7 ± 0.30 | 266.4 ± 0.29 |
266.54 ± 0.31 |
<0.051 |
|
See Table 1 for feed composition. Body weight is in kg ± standard error of the mean; 1 Not significant after Bonferroni adjustmentments on days 0 or 68. However, the mean LBP of group N was lower than that of groups MS and MCD (P = 0.001 and 0.0004 respectively) on day 96 (Figure 6).
Histopathology and Frequency of Liver Abscess
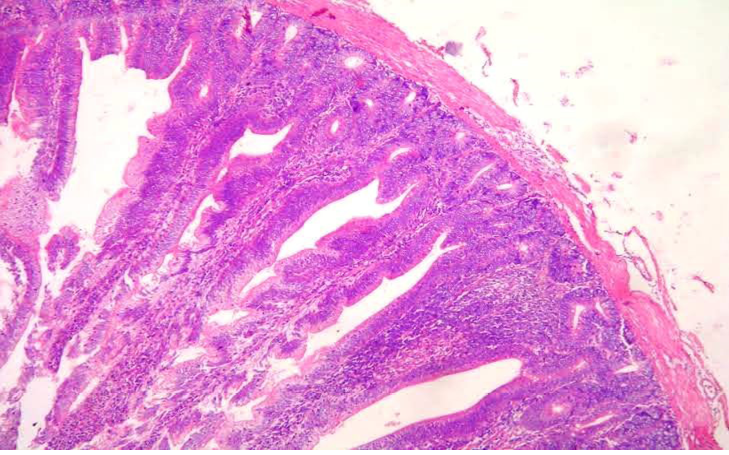
The diet shad no effects on epithelium or lamina propria inflammation (P>0.37). Parakeratosis, epithelium and lamina propria damage were classified as none or mild except for one sample in the MS group and two in the MSD group that were graded as moderate (Figure 7). Liver rejection was similar (P=0.80) among the experimental groups, at respectively 11.7%, 10.4%, 11.7%, and 7.5% for MS, MSD, MCD and BCD.
Discussion
The results reported in the present study showed no significant difference in ADG except for barley-fed calves towards the end of the growing phase. This is in contrast with previous work by Noon et al. (1998) who reported an
Table 3: Effects of experimental diets on dry matter intake(DMI), starch and NDF intake of grain-fed Holstein bull calves*.
| Period | Days 0–27 | Days 28–54 | Days 55–85 | Days 86–96 | |||||||||||||||
| Feed | MS | MSD | MCD | BCD | MS | MSD | MCD |
BCD |
MS | MSD | MCD |
BCD |
MS | MSD | MCD |
BCD |
|||
|
DMI (kg d-1) |
3.36 | 3.13 | 3.14 |
3.16 |
5.4 | 4.91 | 4.94 |
5.37 |
5.13 | 4.73 | 4.68 |
5.19 |
6.55a |
5.78b |
5.99ab |
6.49 a |
|||
| SEM | 0.04 | 0.02 | 0.03 |
0.03 |
0.05 | 0.02 | 0.05 |
0.05 |
0.05 | 0.03 | 0.05 |
0.06 |
0.06 | 0.03 | 0.02 | 0.05 | |||
|
Starch (kg d-1) |
1.87a |
1.51b |
1.40b |
1.22b |
3.11a |
2.46b |
2.39b |
2.19b |
3.15a |
2.57b |
2.47b |
2.32b |
3.99a |
3.06b |
3.15b |
2.87b |
|||
| SEM | 0.02 | 0.01 | 0.01 |
0.01 |
0.03 | 0.01 | 0.02 |
0.02 |
0.02 | 0.02 | 0.02 |
0.03 |
0.04 | 0.02 | 0.01 | 0.02 | |||
|
NDF (kg d-1) |
0.64c |
0.78b |
0.8b |
0.99a |
0.99c |
1.20b |
1.19b |
1.65a |
0.87c |
1.08b |
1.08b |
1.55a |
1.01c |
1.27b |
1.28b |
1.84a |
|||
| SEM | 0.01 | 0.01 | 0.01 |
0.01 |
0.01 | 0.01 | 0.02 |
0.01 |
0.01 | 0.01 | 0.01 |
0.02 |
0.01 | 0.01 | 0.01 |
0.01 |
|||
* Average of 10 calves per pen, 7 pens per treatment; See Table 1 for feed composition; abc Differing letters in the same row denote intra-phase significance (P<0.05). Same letter denotes similar results or similar results after Bonferroni adjustment
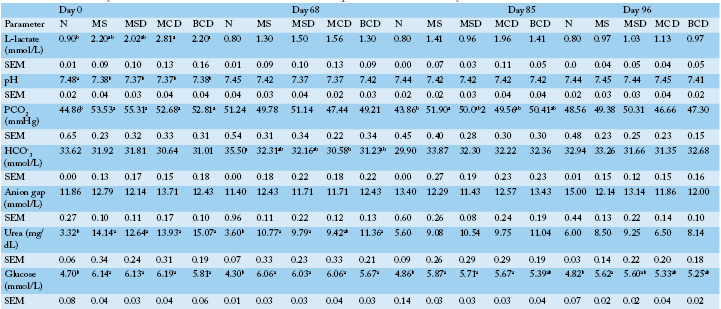
Table 4: Blood chemistry results for Holstein bull calves fed one of the five experimental diets for 96 days.
See Table 1 for experimental diet composition. See Materials and Methods for thecomposition offeed N. The N group was also fed0.7 kg of MS twice per day. abc Differing letters in the same row denote intra-phase significance (P<0.05). Same letter denotes similar results or similar results after Bonferroni adjustment
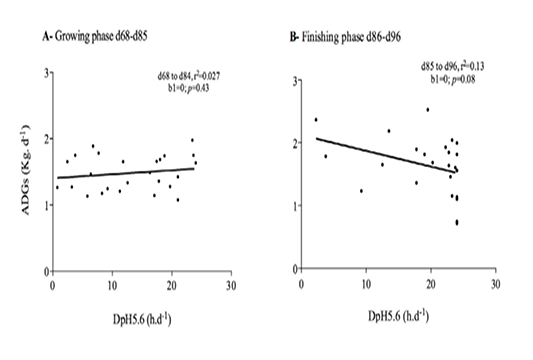
Figure 5 Relationship between average daily gain and average time per day below pH 5.6 (DpH5.6) in the rumen of Holstein bull calvesraised on experimental diets (See Table 1 for composition) A: growing phasedays 68–84; B: finishing phase days 85–96; b1 denotesthe linear regression slope and does not deviate from 0 (p>0.05).
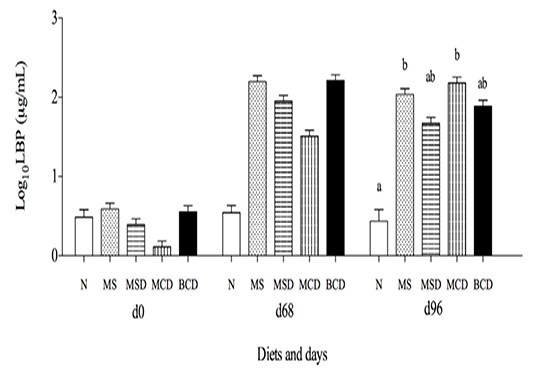
Figure 6: Lipoprotein binding protein (log10normalized mean ± SEM) in Holstein bull calves raised on different experimental diets. (See Table 1 and Materials and Methods for composition)Differing letters denote significant difference (p<0.05). Treatment effects on day 68 were similar after Bonferroni adjustment.
ADG of 1.68 kg and a G/F ratio of 0.36 in calves raised on feed similar to MS, with linear decreases to 1.38kg and 0.27 respectively as the maize portion was replaced entirely with whole barley. Linear decreases in dry matter, organic matter, crude protein, starch and energy digestibility were noted in that study as the proportion of whole barley increased. The digestibility of rolled barley may be superior. In the present study, the ADG was significantly lower for all calves during the day 54–85 period, which coincided with high ambient air temperature with no cooling at night (25–30°C), combined with high relative humidity (95–100
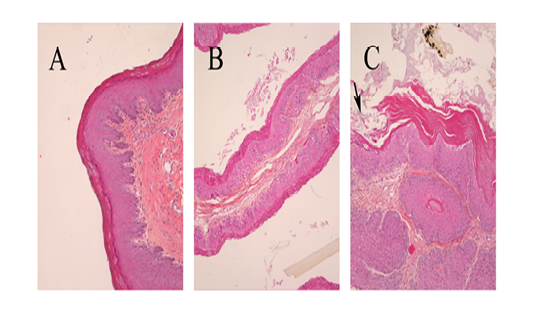
Figure 7 Photographic images of representative sections of the rumen atrium base in Holstein bull calves (A and B: normal epithelium and lamina propria in calves fed respectively N and BCD diets; C: arrow designates maize-diet-associated damage to epithelium).
-%). Although the barn was well ventilated, it is possible that the prevailing weather decreased calves’ performances during this period. Yazgan et al. (2013) classified the impact of such conditions on lactating cows as moderate to severe. Decreased feeding and growth of calves at temperatures above 25 °C have already been reported (Broadwater, 2010). DMI during this period (Table 3) was consistently lower than during the previous period, where as it should have increased.
In this study, diets containing 20% DDGS or canola meal had no effect on DMI, ADG, G/F ratio or rumen pH during the starting and growing phases compared to the MS diet. Towards the end of the growing phase, ADG, G/F ratio and rumen pH were similar, while DMI decreased among calves fed MSD diet compared to MS. Ham et al. (1994) reported that inclusion of 20 % wet corn distillers’ grain plus soluble matter or DDGS in a dry-rolled-maize-based feed increased DMI and ADG in crossbred beef calves of similar body weight. Buckner et al. (2007) also reported an improved grow thin finishing steers when 20 % of the feed was replaced with DDGS. In a review article, Klopfenstein et al. (2008) concluded that distillers’ grains are suitable for growing cattle, although they examined no study of grain-fed dairy calves fed whole shelled maize. In the present study, partial replacement of maize-based diet with DDGS and canola meal appeared to support comparable growth in grain-fed calves.
We found carcass yield to be similar for all maize-based diets but lower for the barley diet. Several studies have shown that grain source in finishing diets has little or no effect on warm carcass weight (Boles et al., 2004; McEwen and Mandell, 2002). The calves fed barley diet ingested significantly more NDF than did calves in the other groups (Table 3). Lower carcass yield among steers raised on feed richer in NDF has been reported previously (Berthiaume et al., 2006). These lower yields might be due to greater development of the rumen.
To prevent rumen acidosis in dairy cattle, concentrates should make up less than 45% of the dry matter and starch less than 25% (Sauvant et al., 1999). A maize-based cattle feed contains at least 57% maize. The starch content of the diets used in the present study ranged from 34 %for one of the starter diets to 54% for one of the finisher diets. This might explain why the latter feeds caused more acidosis (Figure 4). Based on dairy cow feeding standards and according to AlZahal et al. (2007), all of the feeds used in the present study (except for N) were acidotic, and they did give DpH5.6 values exceeding 3 h. The maize-based feeds produced greater DpH5.6 during the growing and finishing phases than did the barley-containing feeds. However, we observed no clinical case of severe acidosis. Laarman et al. (2016) with Holstein steers of similar weights as those in the present study, gave high barley diets challenge and observed rumen pH below 5.6, but did not report any case of severe acidosis. Similarly, Huls et al. (2016) observed DpH5.6 exceeding 5 hours without negative impact on growth performance. Young animals might be more resistant than adults to acidosis. The starch content of the BCD diet was in between that of MS and other diets. In addition, starch digestibility is normally greater for barley than for maize processed to the same degree (Huntington, 1997). It was therefore expected that BCD diet would bring the rumen pH down lower, but this was not observed in this study. Yang et al. (2001) reported that the drop in rumen pH in barley-fed dairy cows is proportional to the degree of processing of the grain. The barley used in the present study was dry-rolled, which is not an extensive processing. Maize was fed unprocessed, but young ruminants are known for superior chewing capacity.
The linear regressions lopes and Pearson’s correlation coefficients showed that DpH5.6 did not significantly affect ADG, which is consistent with a previous report that adapting feedlot cattle with incremental increases in dietary concentrate from approximately 55 % to 90% DM affected rumen pH but not ADG (Brown et al., 2006).
We found that blood L-lactate levels were within the reference range (0.5 to 2.5 mmol/L) as reported by Omoole et al. (2001) for calves up to the age of 41 days. However, we noted a slight decrease over time, as reported in heifers by Gentile et al. (2004), and this could be due to the proliferation of lactate-utilizing bacteria in grain-adapted cattle (Goad et al., 1998; Brown et al., 2006).
Blood pH values increased over time (Table 4) but were within the normal range (7.44 ± 0.002) as reported by Morgante et al. (2009). According to Negny (2002), blood pH could remain unchanged because of respiratory compensation.
All PCO2 values, including those in the control group, were above normal (44.33 ± 0.51 mmol/L) for healthy dairy cows (Morgante et al., 2009), and were close to those of steers with rumen acidosis (50 mmol/L) as reported by Brown et al. (2000) and Angelov et al. (2009). However, some authors (Di Nardi et al., 2013; Marchesini et al., 2013) have suggested that 50 mmol/L is too low to be taken as the threshold for acidosis in young animals.
The N group had higher blood HCO3- (33.0±4.33 mmol/L) than reported elsewhere (Oomole et al., 2001). However, the acidotic diets did not decrease HCO3- relative to the values measured in the N group. Blood HCO3-remained close to the normal value of 30 mmol/L and did not decrease during rumen acidosis, as reported by Goad et al. (1998).This finding is in contrast with those of Marchesini et al. (2013), although these authors showed that the level of starch had little effect on HCO3-,which is consistent with the present results Blood pH, PCO2 and HCO3-may all change in response to blood lactate levels (Negny, 2002).
The blood urea measured for the N group in the present study (4.27 ± 1.6 mmol/L) was close to the value for calves, while the value for the other groups (11.2 ± 4.4 mmol/L) was in the range associated with rumen acidosis, as reported by Kasari and Naylor (1986). The N group also had blood glucose levels close to the normal value reported by Marchesini et al. (2013) and Kasari and Naylor (1984), while the other groups had higher values close to those associated with rumen acidosis (Marchesini et al., 2013)except for during the finishing phase. The effect of the experimental diets on blood urea and glucose was significant at the beginning of the experiment perhaps because the N-fed calves had not received the adaptation diet, which contained more starch and protein. Most of these differences had disappeared by the end of the growing phase or during the finishing phase, and values in calves raised on the maize-based and barley-based diets decreased over time. This suggests an improvement of rumen function and confirms the above-mentioned adaptation of calves.
During rumen acidosis, increased LBP is an indicator of endotoxin translocation (lipopolysaccaride) from the rumen to the bloodstream (Ametaj et al., 2009), since this protein is involved in facilitating the clearance of circulating LPS (Gallay et al., 1994). LBP in all experimental groups increased during the finishing phase (days 68–96) and exceeded the peak of 1.36 log10measured by Ametaj et al. (2009) in steers feda diet consisting of 91% barley. This is likely due to starch, as demonstrated by Marchesini et al. (2013) who found that log10mean LBP was 0.77, 0.98 and 1.02 respectively in heifers fed low (17.3%), medium (33.4 %) and high starch (42.8 %) diets. In our study, it was the MS and MCD diets that contained most starch, and only the groups that received these diets had LBP levels on day 96 that were unequivocally higher than those in the negative control group.
Conclusion
Substituting maize-based diet with DDGS, canola meal and barley did not reduce livestock performance or have detrimental effects on blood metabolites or rumen function and integrity in grain-fed calves. Total replacement of maize with corn DDGS, canola meal and rolled barley increased rumen pH and improved ADG during the finishing phase. An isonitrogenous diet made of barley, DDGS and canola meal is thus found suitable for raising grain-fed calves. The lack of effects of rumen pH below 5.6 on ADG and blood parameters makes the pH threshold of 3 hours per day below 5.6 of no risk of acidosis in calves aged from 6 to 7 months.
Acknowledgements
This work was supported by the « Programme d’appui financier aux regroupements et aux associations de producteurs désignés »of the Ministère de l’Agriculture, des Pêcheries et de l’Alimentation du Québec. The authors are grateful to the Fédération des producteurs de bovins du Québec for supporting this project, to Délimax for help throughout the experiment and to Julie Chapron for her leadership in the animal trial. Dr.Guy Beauchamp is gratefully acknowledged for his assistance in statistical analysis.
Conflict of interest
The authors declare no conflict of interest.
Authors Contribution
Yassin Najid was the graduate student on this project. He completed his M.Sc. since. Yvon Couture, participated in the conception of the projectand of the project, Sonia Chénier, participated in the analysis needed in the project, Alain Fournier participated in the conception of the project. This colleague is now deceased, Dany Cinq-Mars Participated in every step of the project and was the codirector of the graduate student, YounèsChorfi participated in every step of the project and was the director of the student.
References


