Advances in Animal and Veterinary Sciences
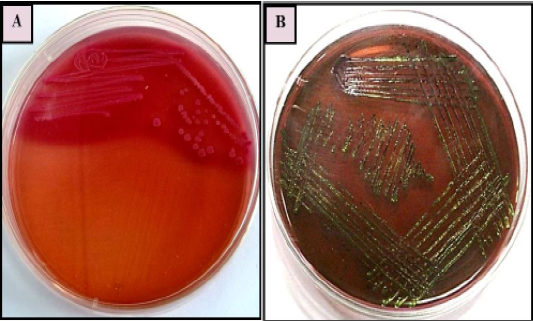
E. coli colonies with characteristic (A): Pink colour, lactose fermenting colonies on MacConkey agar (B) greenish metallic sheen on Eosin methylene blue (EMB) agar
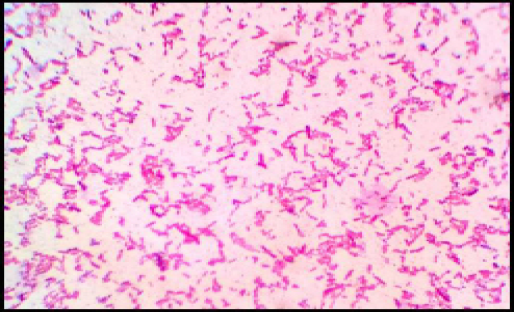
Gram staining showing gram negative E.coli bacilli
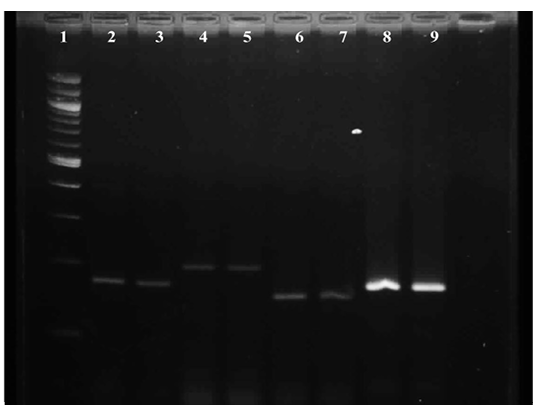
Gel image showing amplified product of E.coli virulence gene
Lane 1 : Molecular Marker of 100 bp; Lane 2: iss +ve control; Lane 3: iss representative sample; Lane 4: papC +ve control; Lane 5: papC representative sample; Lane 6:tsh +ve control; Lane 7: tsh representative sample; Lane 8: vat +ve control; Lane 9 : vat representative sample
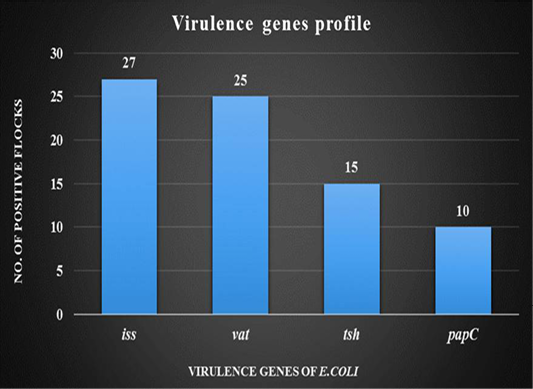
Graph showing virulence genes profile of thirty broiler flocks positive for Avian Pathogenic E.coli
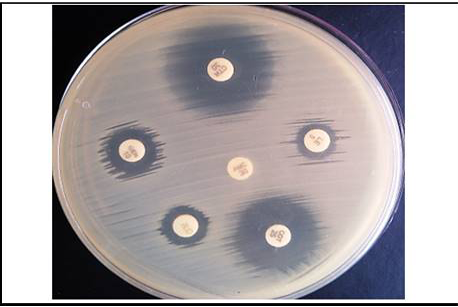
Plate showing in-vitro Antibiotic Susceptibility Test for E.coli isolates
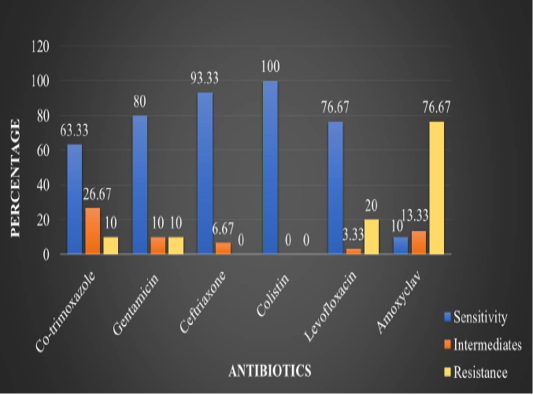
Graph showing percentage of in-vitro Antibiotic Susceptibilityof the E. coli isolates


