Advances in Animal and Veterinary Sciences
Case Report

Effect of Insulin on Post-AI Circulating Sodium and Potassium in Crossbred Cattle
Mridula Sharma, H.P.Gupta, Shiv Prasad
Department of Veterinary, Gynaecology and Obstetrics, College of Veterinary and Animal Sciences, G. B. Pant University of Ag. & Tech., Pantnagar-263145 Distt- U.S. Nagar, Uttarakhand, India.
Abstract | The present study was conducted to evaluate the effect of insulin on blood levels of sodium and potassium in crossbred cattle. To this end, forty-eight cows were divided into treatment (I, II and III) and control groups each consisting of 12 animals. Insulin was injected @0.25 IU/Kg body weight subcutaneously on day 0-3, 4-7 and 8-11 of estrous cycle in group I, II and III, respectively and PBS was injected in control animals. Blood samples were collected on day 0, 5, 10, 16 and 21 of estrous cycle. Sodium and potassium concentrations were determined in serum. Potassium level varied significantly (P<0.05) between pregnant and non-pregnant animals of group III on day zero of estrous cycle and may be considered as markers of pregnancy. Insulin administration did not affect the serum potassium and sodium level but higher potassium in pregnant animals indirectly shown its positive effect on conception rate.
Keywords | Insulin, Crossbred, Sodium, Potassium, Cow, Post-AI
Editor | Kuldeep Dhama, Indian Veterinary Research Institute, Uttar Pradesh, India.
Received | May 19, 2017; Accepted | June 11, 2017; Published | August 08, 2017
*Correspondence | Mridula Sharma, Department of Veterinary, Gynaecology and Obstetrics, College of Veterinary and Animal Sciences, G. B. Pant University of Ag. & Tech., Pantnagar-263145 Distt- U.S. Nagar, Uttarakhand, India; Email: sharmavetmridula@yahoo.co.in
Citation | Sharma M, Gupta HP, Prasad S (2017). Effect of insulin on post-ai circulating sodium and potassium in crossbred cattle. Adv. Anim. Vet. Sci. 5(8): 324-328.
DOI | http://dx.doi.org/10.17582/journal.aavs/2017/5.8.324.328
ISSN (Online) | 2307-8316; ISSN (Print) | 2309-3331
Copyright © 2017 Sharma et al. This is an open access article distributed under the Creative Commons Attribution License, which permits unrestricted use, distribution, and reproduction in any medium, provided the original work is properly cited.
Introduction
Application of metabolic hormones i.e. somatotrophin, insulin and insulin like growth factors (IGF-1) in regulation of ovarian functions in livestock is a recent development. The increased plasma IGF-1 level during follicular phase following administration of insulin may affect the development of the follicles and function of corpus luteum (Leeuwenberg et al., 1996). Insulin not only stimulates the follicle production, estrogen synthesis but also has a role in production of progesterone from luteal cells and development of embryo. Information regarding the effect of insulin administration during follicular and luteal phase of the cycle on conception rate in cows is limited.
Sodium is a major extra-celluar cation and plays an active part in regulating the neutrality of blood serum. It is important for maintaining osmotic pressure, controlling water balance, regulating acid-base balance, contracting muscles, transmitting nerve impulses, and carrying glucose and amino acids. Sodium is necessary for the operation of some enzyme systems. Potassium is a major intracellular cation and is involved in acid-base balance, osmotic pressure regulation, water balance, muscle contractions, nerve impulse transmission, oxygen and carbon dioxide transport in the blood, and enzyme reactions. An ionic balance exists amongst K, Na, Ca and Mg.
The sodium-potassium pumping mechanism of cells actively maintains high levels of K+ and low levels of Na+ intra-cellularly and requires energy in the form of ATP (Block, 1994). Because glucose is the main source of cellular energy, a slowdown of the sodium-potassium pump would not allow cells to operate at full potential, especially for the active mammary gland for which high quantities of glucose are used for lactose synthesis. Obviously, excess of one cation in relation to other cation causes the pump to slow (causing the cell to use more energy in pumping but obtain less glucose) or to speed up beyond an optimal level (creating high energy requirements to maintain the cell) (Afzal et al., 2004). In vitro studies on isolated perfuse dog kidney (Nizet et al., 1971) have suggested an effect of insulin on sodium transport. Insulin initiates its action by interacting with specific membrane receptors located on the plasma membrane of target cells (Nicola et al., 2001). The insulin-receptor complex activates a number of cellular functions, among which is transmembrane transport of ions and nutrients (Nicola et al., 2001) One cellular action of insulin is an effect on ion transport in general and on stimulation of the Na+,K+-ATPase activity in particular (Moore, 1983; Ewart and Klip 1995; Kahn and Song 1995). This will lead to relaxation of the smooth muscle cell and hence in the vascular bed to vasodilation (Kahn et al., 1993).
This means that insulin-induced vasodilation may in theory be explained by stimulation of the Na+, K+-ATPase in vascular smooth muscle cells. However, Na+,K+-ATPase is also located in endothelial cells (Meharg et al., 1993) in which hyperpolarization will lead to an influx of calcium into the cell because of the increased electrogenic driving force calcium channels in endothelial cells are voltage independent (Luckhoff and Busse 1990). The increase in cytosolic Ca2+ concentration will stimulate endothelial synthesis and release of nitric oxide (Moncada and Palmer 1990). Therefore, an alternative explanation for the mechanism of insulin-induced vasodilation could be insulin-mediated stimulation of endothelial Na+,K+-ATPase, giving rise to NO-dependent vasodilation (Scherrer, et al., 1995). Plasma potassium concentration decreased during insulin administration, concomitant with a presumed net influx of potassium into liver and skeletal muscle (Fineberg and Merimee 1973; Andres et al., 1962).
Therefore, the present study was designed to observe the effect of Insulin on circulating sodium (Na), potassium (K) in cross-bred cows.
MATERIALS AND METHODS
The present study was conducted on 48 crossbred cyclic cows aged 4-12 years, maintained at Instructional Dairy Farm, GBPUA&T, Pantnagar (Uttarakhand). Cows were divided into four groups (n=12), as per the day of insulin (0.25 IU/kg subcutaneously) treatment. It was day 0-3, 4-7 and 8-11 of oestrous cycle in group I, II and III. Fourth group served as control and PBS was injected in equal amount to insulin suspension. Blood samples were collected on day 0, 5, 10, 16, and 21 of estrous cycle. Animals were detected in oestrus and artificially inseminated with frozen semen. Blood samples (5-10 ml) were collected and serum was stored at -20°C till analysis. Sodium and potassium concentrations were determined (Oser, 1965). Diluted standards, serum and urine samples were aspirated in to atomizer of flame photometer (Elico, Hyderabad Model CL* – 361) and concentrations of both minerals were read directly from the display. The data obtained in the present study was analyzed statistically as per the methods described by Snedecor and Cochran (1994).
Results and discussion
Blood level of sodium (mEq/l) in insulin treated crossbred cows was estimated and presented in Table-1 and Figure 1 and 2. Its concentration in group I, II, III and IV varied non-significantly in different days (Appendix 1-4). Serum sodium concentration in insulin treated pregnant and non-pregnant animals is presented in Table 2 and Figure 3.
The sodium level in our study was not affected by insulin treatment whereas; marked increase in sodium excretion was observed after abrupt withdrawal of insulin therapy (Atchley et al., 1933). Similar observations have been made by (Saudek et al., 1974) which stated that as the insulin-receptor complex activates a number of cellular functions, among which is transmembrane transport of ions and nutrients (Nicola et al., 2001). It occurs very rapidly and reaches to a maximum after only 10 min (Longo, 1996). In present study the samples were taken after the gap of 5 or 6 days and hence it could not correspond to the results reported.
Blood level of Potassium (mEq/l) in insulin treated crossbred cows was estimated and presented in Table 3. ,Fig. 25 and 26.Serum potassium concentration was studied in insulin treated pregnant and non-pregnant animals is presented in Table 4, Figure 4 and 5. Blood level of potassium on day 0, 5, 10, 16 and 21 was analyzed. Its level varied significantly (P<0.05) between pregnant and non-pregnant animals of group III on day 0, whereas. It was significantly (P<0.05) higher in pregnant animals compared to non-pregnant.
In our findings, serum level of potassium differs non-significantly as we did not take blood samples at the time or near to insulin administration since plasma potassium concentration decreased during insulin administration, concomitant with a presumed net influx of potassium into liver and skeletal muscle (Fineberg and Merimee 1973; Andres et al., 1962).
Conclusion
Insulin administration did not affect the serum potassium and sodium level but higher potassium in pregnant animals indirectly shown its positive effect on conception rate. Though the trials on more number of animals is needed to draw the more reliable conclusion.
Table 1 : Blood concentration (Mean±SE) of sodium (mEq/L) during estrous cycle in insulin treated crossbred cows
|
Treatment Groups |
Days of estrous cycle |
||||
|
Day 0 |
Day 5 |
Day 10 |
Day 16 |
Day 21 |
|
|
Group I (n=12) |
136.42±2.51 |
134.25±2.35 |
136.66±3.04 |
136.00±2.61 |
128.58±2.42 |
|
Group II (n=12) |
134.42±2.96 |
137.16±2.49 |
135.83±3.55 |
131.67±2.61 |
136.50±2.65 |
|
Group III (n=12) |
134.50±2.81 |
135.75±2.87 |
137.58±3.47 |
134.75±2.91 |
129.33±1.61 |
|
Group IV (control) (n=12) |
134.08±2.89 |
136.41±2.51 |
135.75±3.44 |
137.25±2.44 |
127.91±2.02 |
Table 2: Blood concentration (Mean±SE) of sodium (mEq/L) during estrous cycle in insulin treated pregnant and non-pregnant crossbred cows
|
Days of estrous cycle |
Treatment Groups |
|||||||
|
Group I |
Group II |
Group III |
Control Group |
|||||
|
Pregnant (n=7) |
Non Pregnant (n=5) |
Pregnant (n=3) |
Non Pregnant (n=9) |
Pregnant (n=5) |
Non Pregnant (n=7) |
Pregnant (n=2) |
Non Pregnant (n=10) |
|
|
Day 0 |
138.57±3.63 |
133.40±3.17 |
130.66±4.91 |
135.66±3.65 |
130.2±3.21 |
137.57±4.00 |
134.5±6.50 |
134.00±3.36 |
|
Day 5 |
136.71±3.88 |
130.8±2.35 |
130.33±1.33 |
139.44±2.94 |
132.60±1.56 |
138.00±4.76 |
139.0±4.0 |
135.90±2.95 |
|
Day 10 |
138.85±3.97 |
133.60±4.89 |
137.33±7.31 |
135.33±4.30 |
134.4±4.22 |
139.85±5.23 |
139.5±5.5 |
135.00±4.03 |
|
Day 16 |
138.85±4.01 |
132.00±2.09 |
132.0±2.30 |
131.55±2.84 |
132.6±3.82 |
136.28±4.32 |
139.0±4.0 |
136.90±2.89 |
|
Day 21 |
130.0±3.74 |
126.60±2.80 |
129.33±3.48 |
138.88±3.01 |
128.0±3.74 |
130.28±1.06 |
124.5±5.5 |
118.60±10.83 |
Table 3: Blood concentration (Mean±SE) of potassium (mEq/L) during estrous cycle in insulin treated crossbred cows
|
Treatment Groups |
Days of estrous cycle |
||||
|
Day 0 |
Day 5 |
Day 10 |
Day 16 |
Day 21 |
|
|
Group I (n=12) |
5.58±0.46 |
5.33±0.35 |
5.83±0.45 |
4.66±0.41 |
5.50±0.35 |
|
Group II (n=12) |
5.25±0.41 |
4.91±0.39 |
5.66±0.48 |
5.25±0.46 |
5.775±0.42 |
|
Group III (n=12) |
5.08±0.48 |
5.16±0.45 |
5.33±0.46 |
4.58±0.46 |
5.58±0.43 |
|
Group IV (control) (n=12) |
5.16±0.40 |
5.83±0.36 |
5.16±0.34 |
5.41±0.41 |
5.16±0.29 |
Table 4: Blood concentration (Mean±SE) of potassium (mEq/L) during estrous cycle in insulin treated pregnant and non-pregnant crossbred cows
|
Days of estrous cycle |
Treatment Groups |
|||||||
|
Group I |
Group II |
Group III |
Control Group |
|||||
|
Pregnant (n=7) |
Non Pregnant (n=5) |
Pregnant (n=3) |
Non Pregnant (n=9) |
Pregnant (n=5) |
Non Pregnant (n=7) |
Pregnant (n=2) |
Non Pregnant (n=10) |
|
|
Day 0 |
6±0.58 |
5±1.04 |
6±0.47 |
5±0.50 |
6.4±0.59 |
4.14±0.50 |
6±0.33 |
5±0.47 |
|
Day 5 |
5±0.30 |
5.8±0.73 |
5±0.10 |
4.88±0.45 |
5.2±0.48 |
5.14±0.73 |
6±0.33 |
5.8±0.41 |
|
Day 10 |
5.4±0.61 |
6.4±0.67 |
6.6±0.88 |
5.33±0.55 |
5.6±0.74 |
5.14±0.63 |
4.5±1.5 |
5.3±0.33 |
|
Day 16 |
4.28±0.47 |
5.2±0.73 |
5±1.15 |
5.3±0.52 |
4.6±0.50 |
4.5±0.75 |
6±0.10 |
5.3±0.49 |
|
Day 21 |
5.71±0.47 |
5.2±0.58 |
6.6±0.88 |
5.4±0.47 |
6.6±0.24 |
4.8±0.59 |
6±0.33 |
5.0±0.33 |
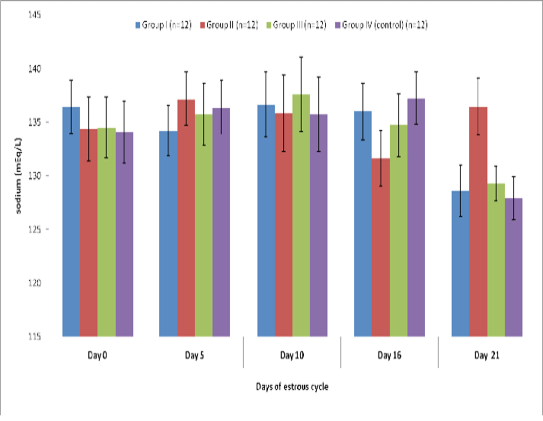 Figure 1: Blood concentration (Mean±SE) of sodium (mEq/L) during estrous cycle in insulin treated crossbred cows
 Figure 2 Blood concentration of sodium (mEq/L) during estrous cycle in insulin treated crossbred cows
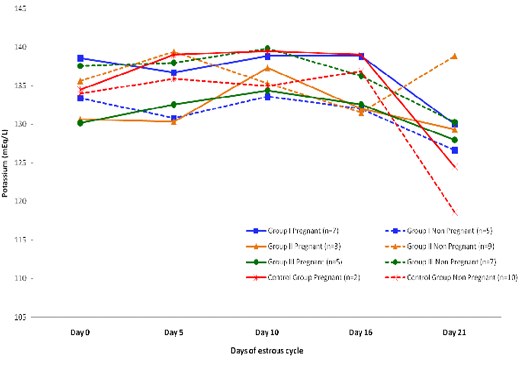 Figure 3: Blood concentration of sodium (mEq/L) during estrous cycle in insulin treated pregnant and non-pregnant crossbred cows
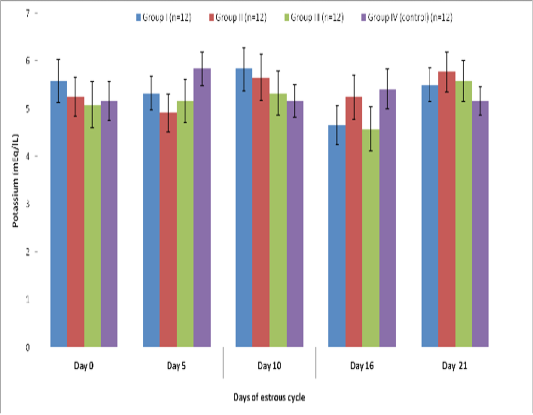
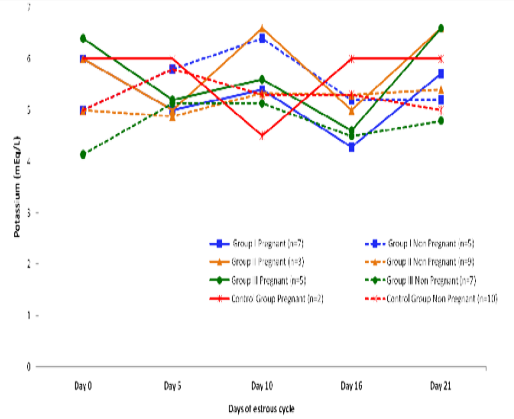 Figure 5: Blood concentration of potassium (mEq/L) during estrous cycle in insulin treated pregnant and non pregnant crossbred cows
Acknowledgment
Authors are thankful to the Dean, College of Veterinary and Animal Sciences and Joint Director, IDF, DES GBPUA & T, Pantnagar, for facilities and financial assistance extended during the course of study.
Conflict of Interest
There is no conflict of interest.
Authors contribution
All the authors have contributed in terms of giving their technical knowledge to frame the article.
References


