Advances in Animal and Veterinary Sciences
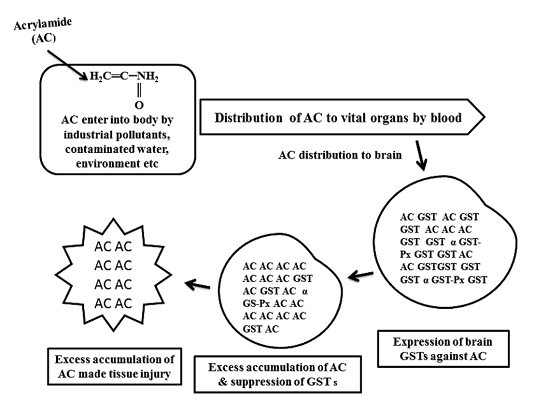
Schematic diagram of glutathione S-transferases (GSTs) expression against acrylamide (AC) and tissue injury by AC
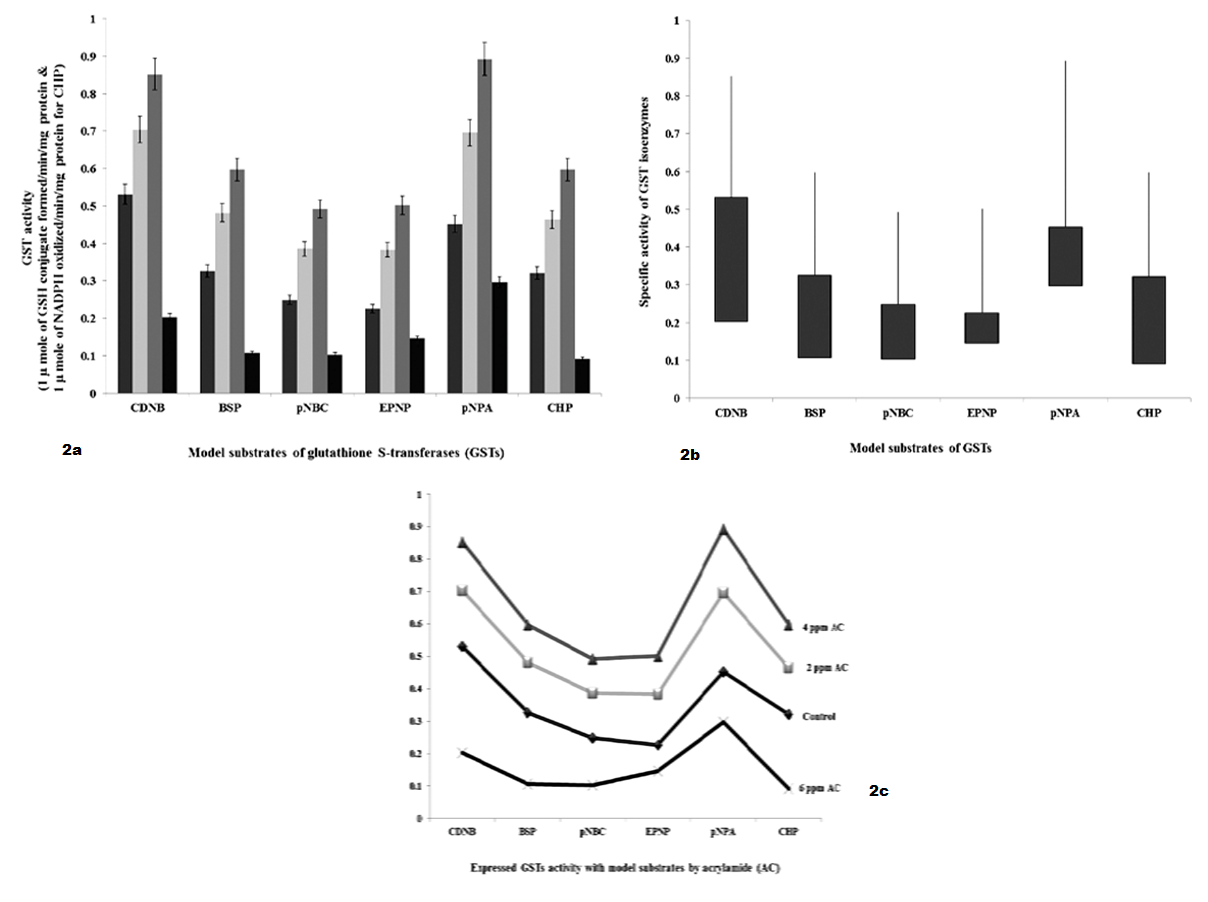
a): GSTs specific activity with model substrates by 24 hours intervening period; b): Differences in GSTs specific activity with model substrates by 24 hours intervening period; c): Expression levels of GST when administered with AC by 24 hours intervening period
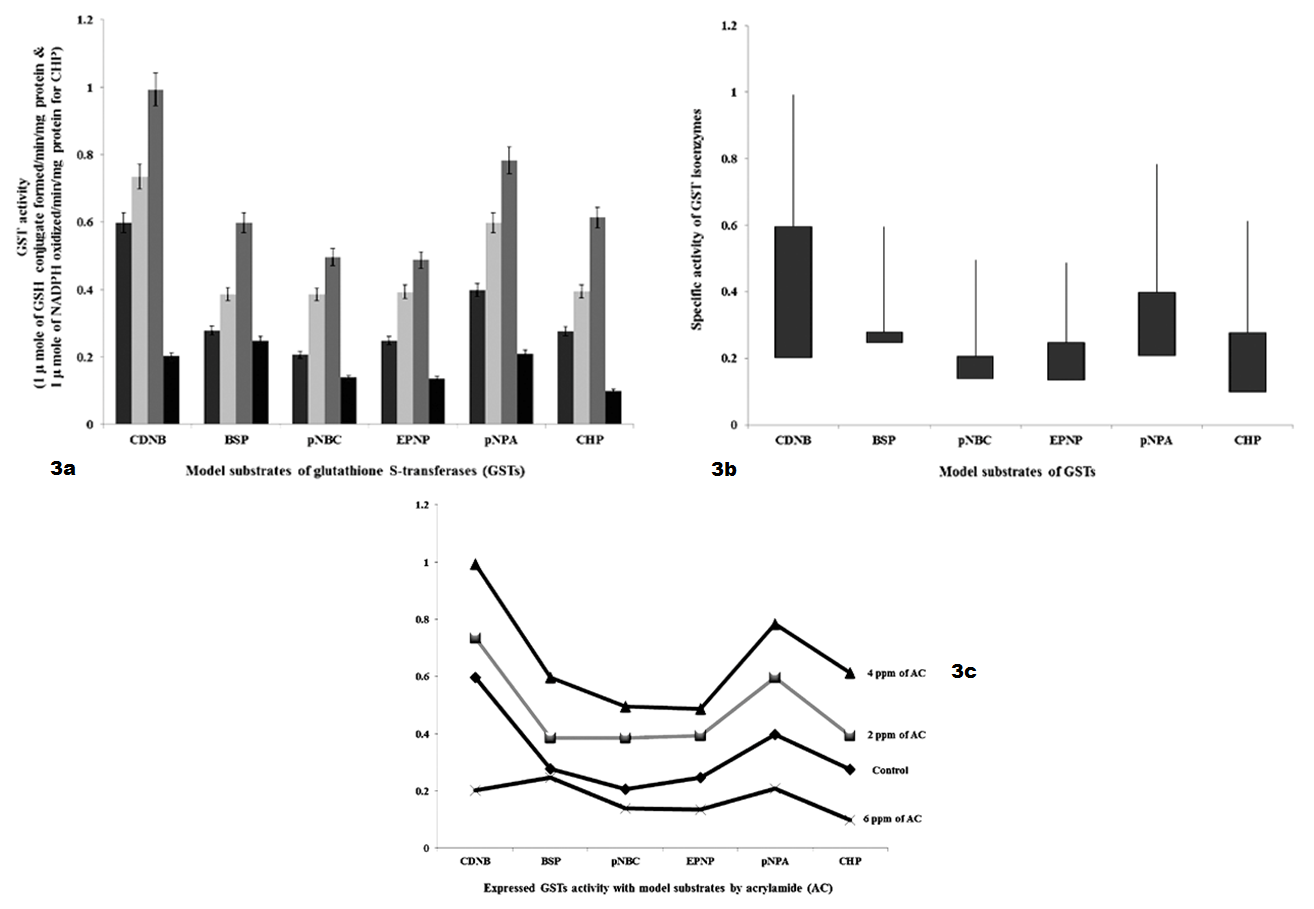
a): GSTs specific activity with model substrates by 48 hours intervening period; b): Differences in GSTs specific activity with model substrates by 48 hours intervening period; c): Expression levels of GST when administered with AC by 48 hours intervening period.
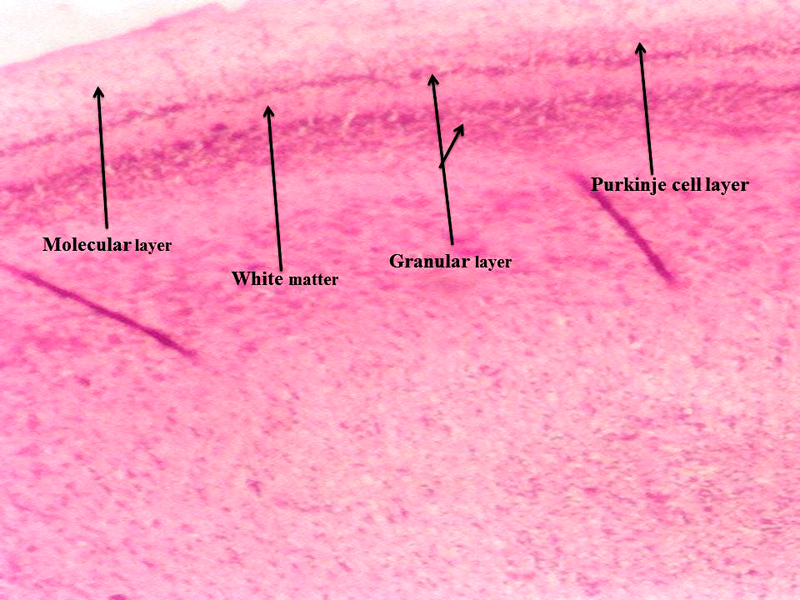
Chick embryo control cerebellum section with molecular layer, Purkinje cell neurons, granular layers and white matter (H & E stain) (10X).
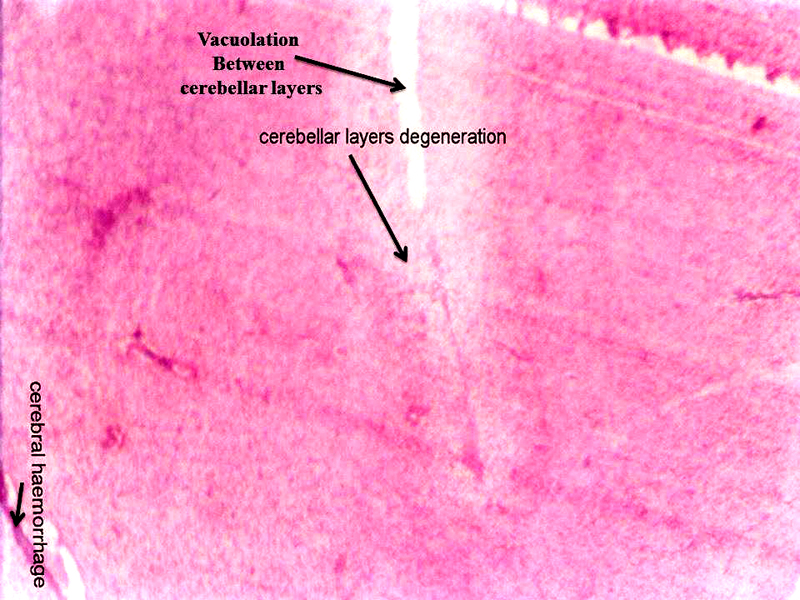
Chick embryo administered with 6 ppm of AC by 24 hours interval, cerebellum section shows vacuolation, cerebral hemorrhage, cerebral layers degeneration (H & E stain) (10X).
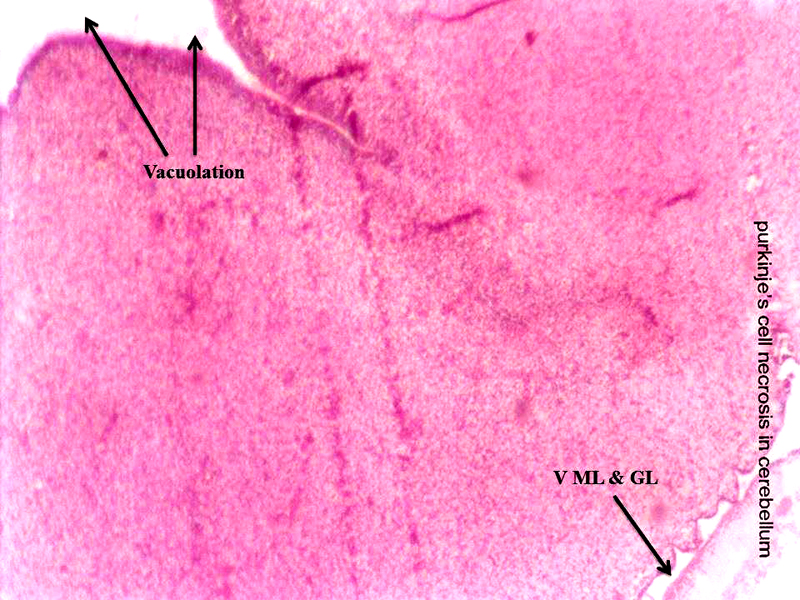
Chick embryo administered with 6 ppm of AC by 48 hours interval, cerebellum section shows vacuolation and vacuolation between granular layer and molecular layer (V ML & GL) and Purkinje cell necrosis (H & E stain) (10X).


