Advances in Animal and Veterinary Sciences
Research Article
Adv. Anim. Vet. Sci. 5(2): 70-77
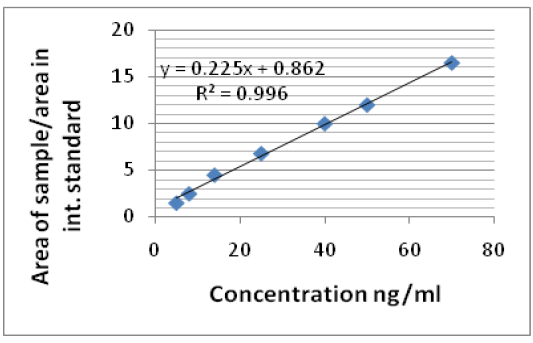
Figure 1
Calibration curve of ciprofloxacin in mobile phase
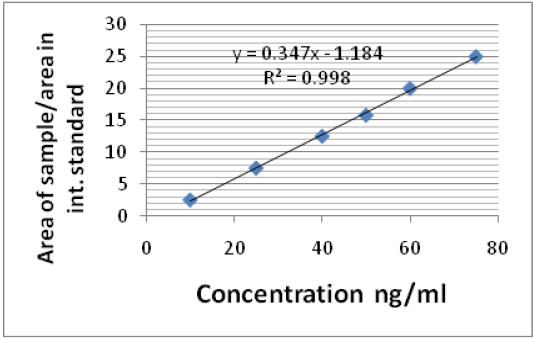
Figure 2
Calibration curve of ciprofloxacin in serum
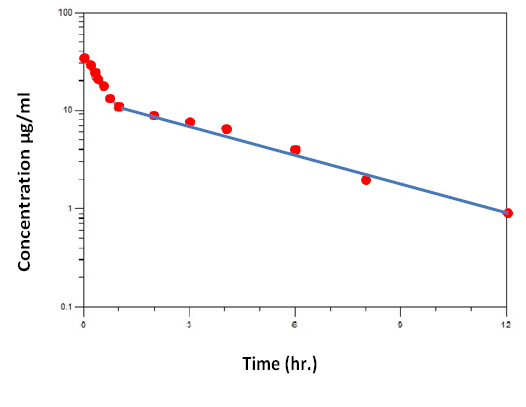
Figure 3
Serum ciprofloxacin concentrations (mean ± se) in 5 dogs after intravenous injection at dose (10 mg / kg bw).
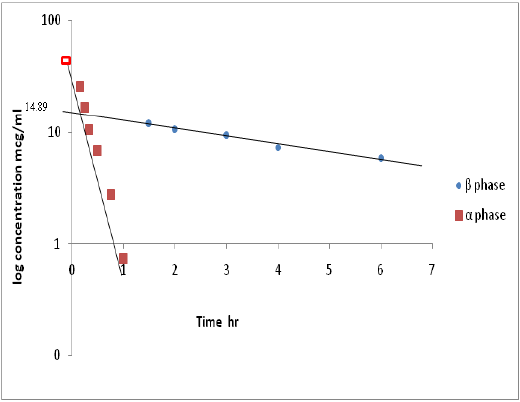
Figure 4
Semi-log plot of µg/ml versus time (hr) shows residual line and µg/ml late line after iv injection of ciprofloxacin.
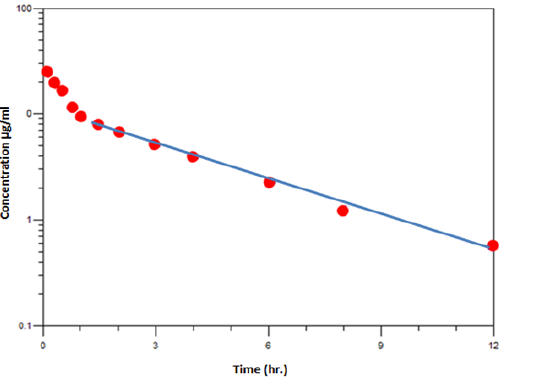
Figure 5
Serum ciprofloxacin concentrations (mean ± se) in 5 dogs after intravenous injection at dose (10 mg /kg b.w) with oral ferrous sulfate (100mg/ kg) given at same time
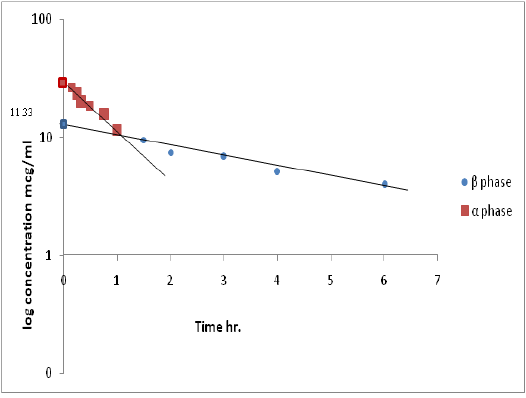
Figure 6
Semi-log plot of µg/ml versus time (hr) shows residual line and µg/ml late line after iv injection of ciprofloxacin with ferrous sulphate.


