Advances in Animal and Veterinary Sciences


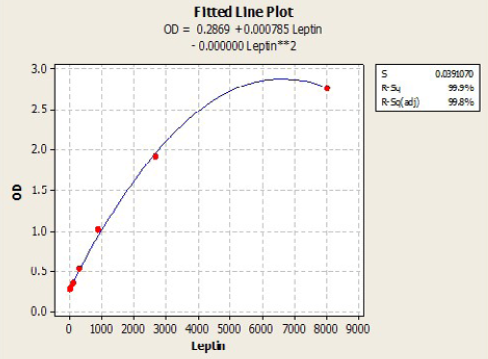
Leptin stander curve according to quadratic equation
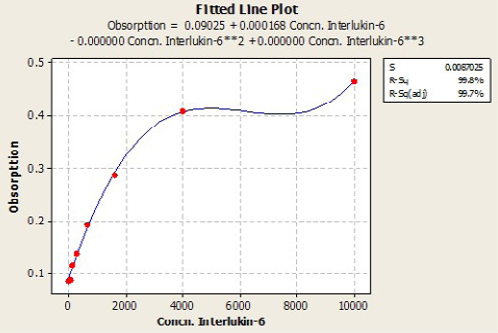
IL6 stander curve according to Cubic equation
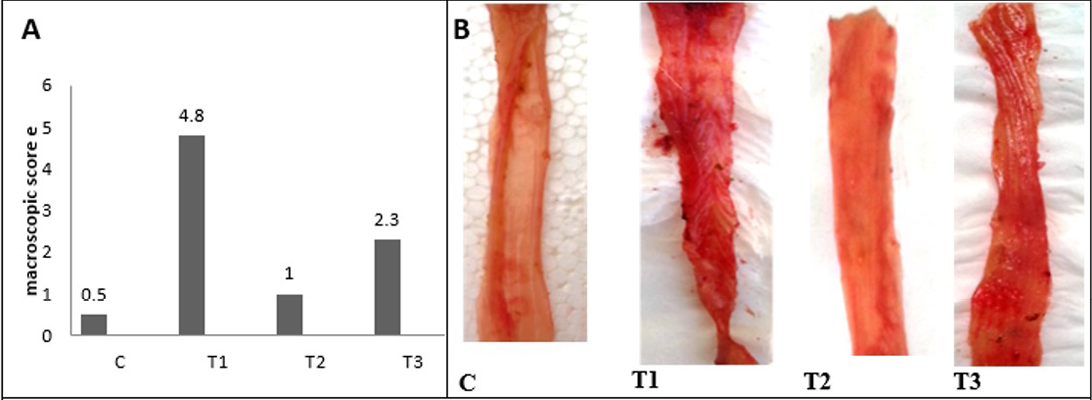
A) Macroscopic scoring of colitis; B) Gross lesion of colon wall after 5 days of colitis; C) control group; T1) Acetic acid colitis group, showing sever blood congestion along the colon with thickness and rough of mucosa; T2) Lactobacillus acidophilus administered; T3) Lactobacillus acidophilus administered and colitis showing small bleeding spots along the colon and thickening in mucosa and the mucosa is clear
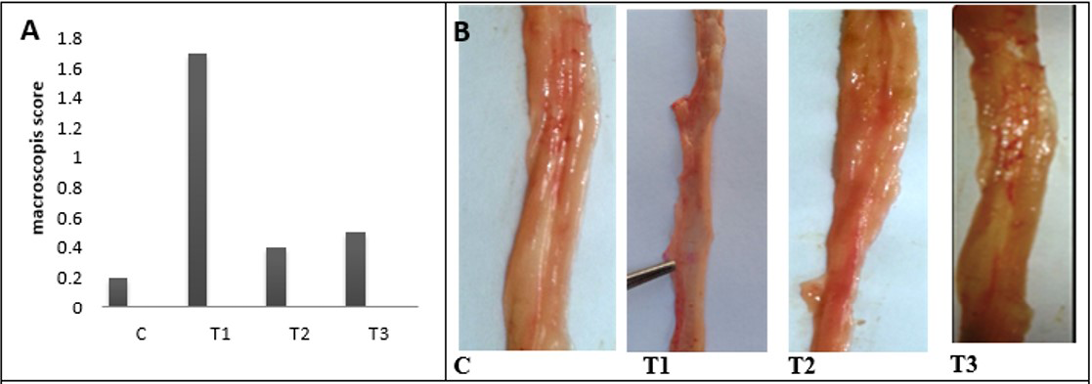
A) Macroscopic scoring of colitis; B) Gross lesion of colon wall after 25 days of colitis; C) control group; T1) Acetic acid colitis group showing thickness and rough of mucosa with large blood patches in different areas of colon; T2) Lactobacillus acidophilus administered; T3) Lactobacillus acidophilus administered and colitis showing small bleeding spots along the colon and thickening in mucosa and the mucosa is clear

Light microscopic photographs of colon wall sections after 5 day in C) control; T1) AA colitis; T2) LBA; T3) AA colitis +LBA; MU) mucosal ulceration; CI) cellular infiltration; AC) atrophy of crypts; LH) lumphoid tissue hyperplasia; P and L) plasma and lymphocytes, CH) crypt hyperplasia; GH) goblet cells hyperplasia; AP) Apoptosis; H and E) X100, 400
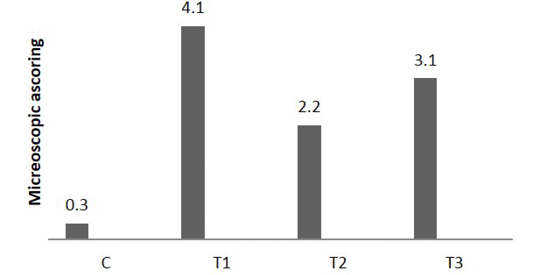
Microscopic score of colitis after 5 days in colon sections, (n = 24). C) control AA colitis; T1); T2) received (5 ×10⁸ CFU) of Lactobacillus acidophilus; T3) received (5×10⁸ CFU) of Lactobacillus acidophilus + AA colitis

Light microscopic photographs of colon wall sections after2 5 day in C) control; T1) AA colitis; T2) LBA; T3) AA colitis + LBA; MU) mucosal ulceration; CI) cellular infiltration; AC) atrophy of crypts; LD) lymphoid tissue depletion; SmT) submucosal tissue; Hand E) X100, 400
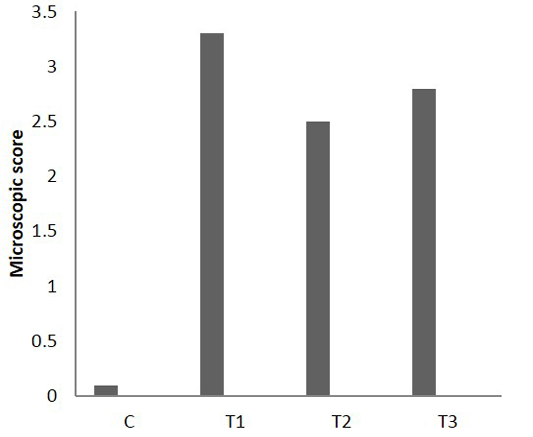
Microscopic score of colitis after 25 days in colon sections, (n = 24). C) Control; T1) acetic acid colitis; T2) (5 ×10⁸ CFU) of Lactobacillus acidophilus; T3) acetic acid
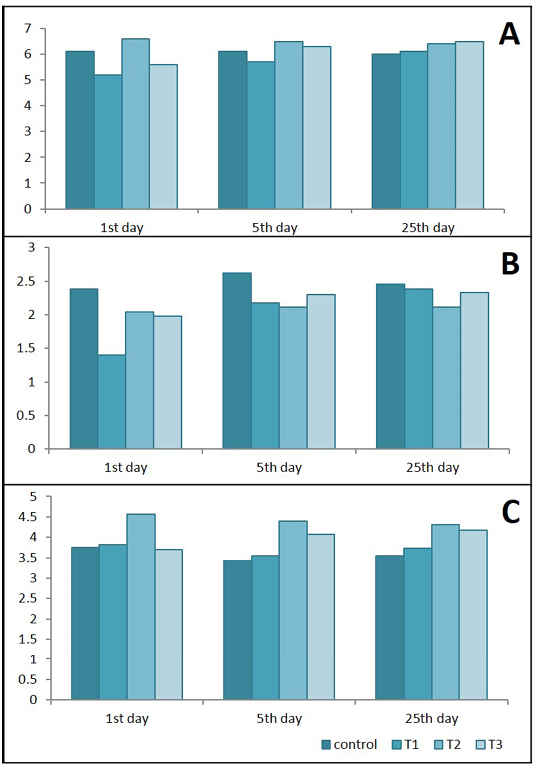
Effects of Lactobacillus acidophilus on A) Serum total protein(g/dl); B) Albumin (g/dl) and C) Globulins (g/dl) in rats with acetic acid colitis, mean±SE, n = 6.
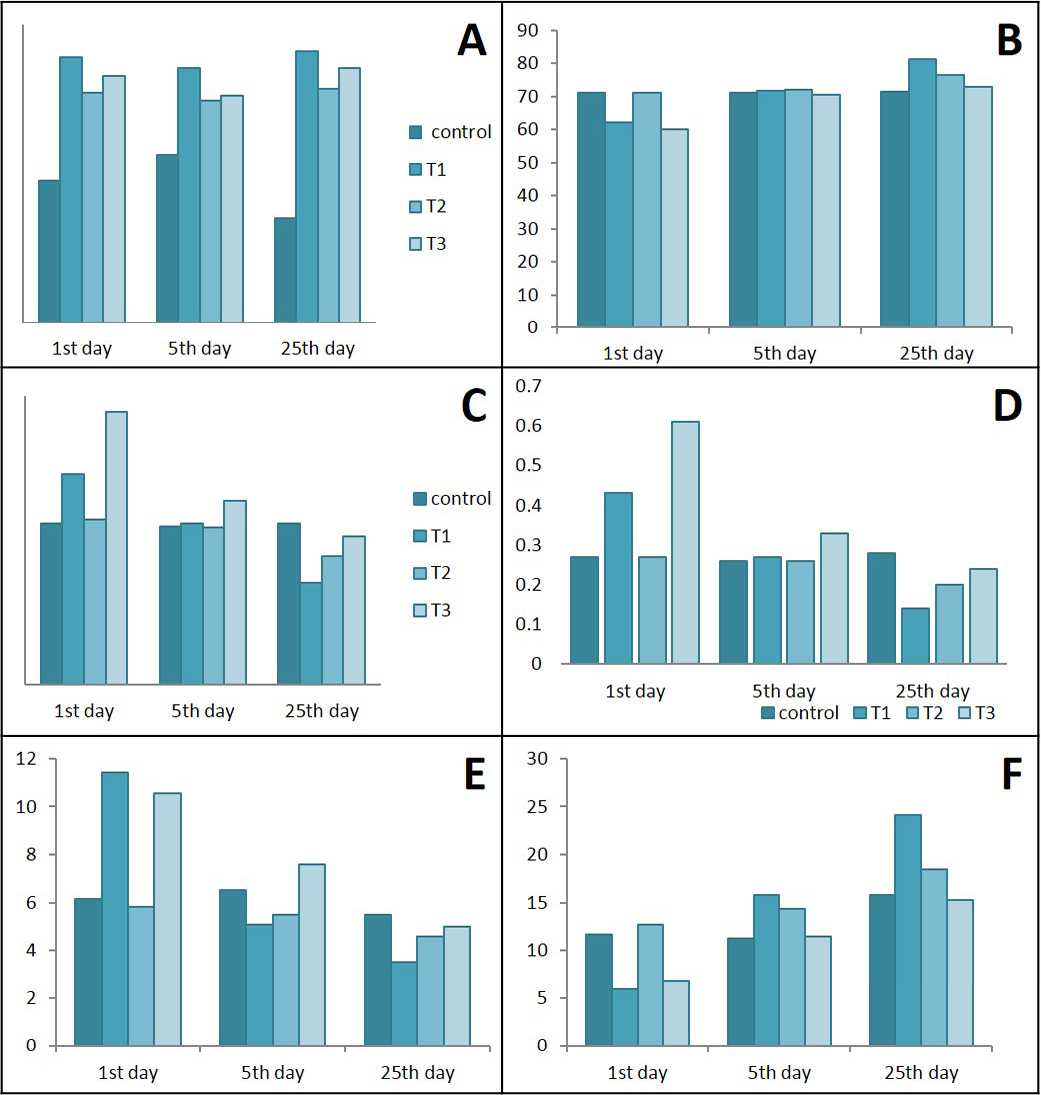
Ameliorative effects of Lactobacillus acidophilus on A) total WBCs; B) Lymphocytes; C) Neutrophil; D) Neutrophils / lymphocytes ratio; E) Monocytes; F) Lymphocytes / monocytes ratio in rats with acetic acid, mean±SE, n = 6.
C) control; T1) have acetic acid colitis; T2) received (5 ×10⁸ CFU) of Lactobacillus acidophilus; T3) have acetic acid colitis and received (5×10⁸ CFU) of Lactobacillus acidophilus
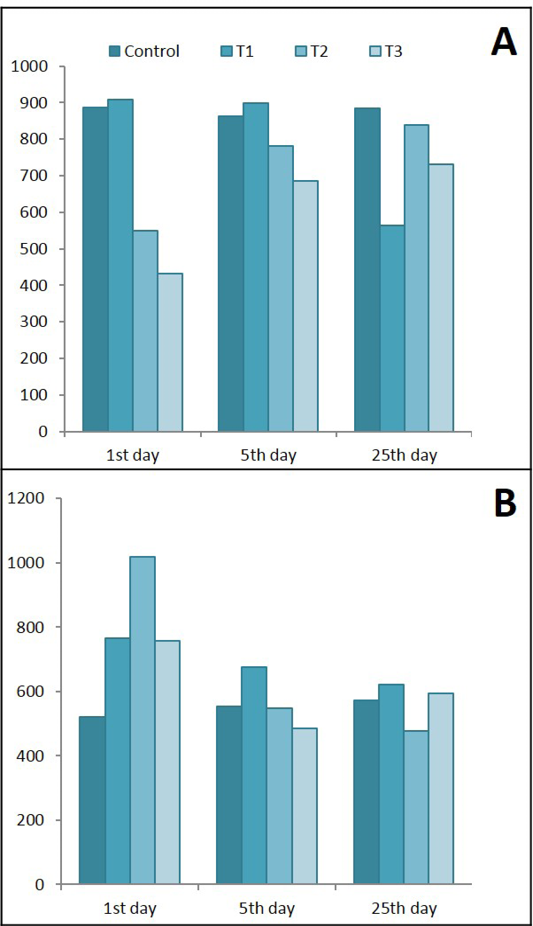
Ameliorative effects of Lactobacillus acidophilus on A) Serum leptin; B) Serum IL-6 in rats with acetic acid, mean±SE, n = 6. C) Control; T1) have acetic acid colitis; T2) received (5 ×10⁸ CFU) of Lactobacillus acidophilus; T3) have acetic acid colitis and received (5×10⁸ CFU) of Lactobacillus acidophilus


