Advances in Animal and Veterinary Sciences
Research Article

Effect of Storage Temperature on Sensory and Microbial Quality of Rastrelliger kanagurta (Cuvier, 1816) from Andaman Coast
Sumitha Gopalakrishnan1, Venu Sasidharan2, Jai Sunder1*, Mothilal Mudavath2, Ravi Ranjan Kumar2
1ICAR-Central Island Agriculture Research Institute, Garacharma, Andaman and Nicobar Islands, India – 744102; 2Department of Ocean Studies and Marine Biology, Brookshabad Campus, Pondicherry University, Chakkargaon, Port Blair, Andaman and Nicobar Islands, India - 744112.
Abstract | The effect of storage temperature on the microbial and sensory quality of Indian Mackerel, Rastrelliger kanagurta (Cuvier, 1816) marketed in South Andaman was assessed during the present study. The fishes kept at room temperature (28°C) were monitored for 5 hours and found that the fishes were still acceptable with little signs of spoilage, a slightly alkaline pH of 7.2 and bacterial load at fish surface of 1.8×10⁴ cfu/cm2. At iced temperature (4°C), belly ruptured at 18th hour and at 24th hour, the eyes became shrunken and the odour became rancid with slight alkaline pH 7.5. The fish was still acceptable based on the sensory standards at 18th hour and the bacterial load of 6.9x 10⁴ cfu/g of the fish tissue at 24th hour. At -5°C temperature, the belly became non-elastic during 4th day and the pressing impressions remained on the body. On the 5th day, the eyes became cloudy and the microbial load of the fish sample was as low as 6.1×10⁴ cfu/g on the 5th day. The bacterial species isolated from the various parts of R. kanagurta during the study were Lactobacillus acidophilus, Bacillus subtilis, Bacillus cereus,Staphylococcus sp., Psuedomonas sp., Flavobacter sp., E.coli, Micrococcus sp., Streptococcus sp., Vibrio sp., Acinetobacter sp., Flavorbacter sp., Klebsiella sp., Proteus vulgaris, Vibrio cholerae, Vibrio parahaemolyticus, Aeromonas sp. and Shigella sp. The study have shown that the shelflife of R.kanagurta collected from South Andaman at ambient (28°C) and iced (4°C) temperatures was 5 hours and 24 hours respectively and the sensory and microbiological approaches in the analysis were all in agreement with the recommended international limits for acceptability. So the Indian Mackerel stored and marketed in Andaman at ambient temperature is best for consumption within the first five hours, 24 hours for iced (4°C) and at -5°C, acceptable even after 5 days.
Keywords | Rastrelliger kanagurta, Spoilage, Sensory analysis, Microbial analysis, Andaman
Editor | Kuldeep Dhama, Indian Veterinary Research Institute, Uttar Pradesh, India.
Received | June 18, 2016; Accepted | August 12, 2016; Published | September 12, 2016
*Correspondence | Jai Sunder, ICAR-Central Island Agriculture Research Institute, Garacharma, Andaman and Nicobar Islands, India – 744102; Email:
jaisunder@rediffmail.com
Citation | Gopalakrishnan S, Sasidharan V, Sunder J, Mudavath M, Kumar RR (2016). Effect of storage temperature on sensory and microbial quality of Rastrelliger kanagurta (Cuvier, 1816) from Andaman Coast. Adv. Anim. Vet. Sci. 4(9): 468-475.
DOI | Http://dx.doi.org/10.14737/journal.aavs/2016/4.9.468.475
ISSN (Online) | 2307-8316;ISSN (Print) | 2309-3331
Copyright © 2016 Gopalakrishnan et al. This is an open access article distributed under the Creative Commons Attribution License, which permits unrestricted use, distribution, and reproduction in any medium, provided the original work is properly cited.
INTRODUCTION
Fish and fishery products are considered all around the world as a rich and cheap source of animal protein and play a major role in preventing malnutrition especially in developing and undeveloped coastal states (Alasalvar et al., 2011; Humaid and Jamal, 2014). Fish is a highly perishable commodity and this has been a main barrier in this sector for transporting, marketing and storage (FAO, 2009; Huss et al., 2003). First couple of hours after the death of fish, the changes, which happened are the biochemical changes due to the autolysis by the resident enzymes (Abbas et al., 2009; Sudalay and Manja, 2012). However, after several hours, the microbial activity on the byproducts from the biochemical spoilage degrades the flesh and tissue components completely providing the unpleasant odour and flow that are associated with spoilage (Huss, 1995). Time and temperature are the critical factors to control and ensure the quality of the fish in relation with freshness (Adams and Moses, 2008; Baixas-Nogueras et al., 2003).
At room temperature, the seafood deteriorates in a faster rate. Storage at low temperatures slows down the bacterial growth and deterioration of fish through enzymatic and chemical changes (Huss, 1988; Oramadike, 2010). Quality can be assessed by the determination of storage life, which is the amount of time which seafood remains palatable. Different species have different storage life, which varies depend upon the oil content, catch, fishing area, season and duration of the rigor mortis.
Indian Mackerel is a species of Mackerels coming under the Family- Scombridae (Order- Perciformes). It is commonly found in Indian and West Pacific oceans and their surrounding seas. It is an important pelagic resource and forms one among the major income for the coastal fishermen community. It forms a major contribution to the marine fish landings as well as one among the most preferred species in the domestic market of Andaman & Nicobar Islands. These fishes were mostly marketed fresh and the freezing and other facilities for storage become familiar to the fishermen in the island only recent. The effect of temperature on the quality of Indian Mackerel marketed through the domestic markets of South Andaman was assessed based on the storage temperature and duration in the present study.
MATERIALS AND METHODS
Sample Collection
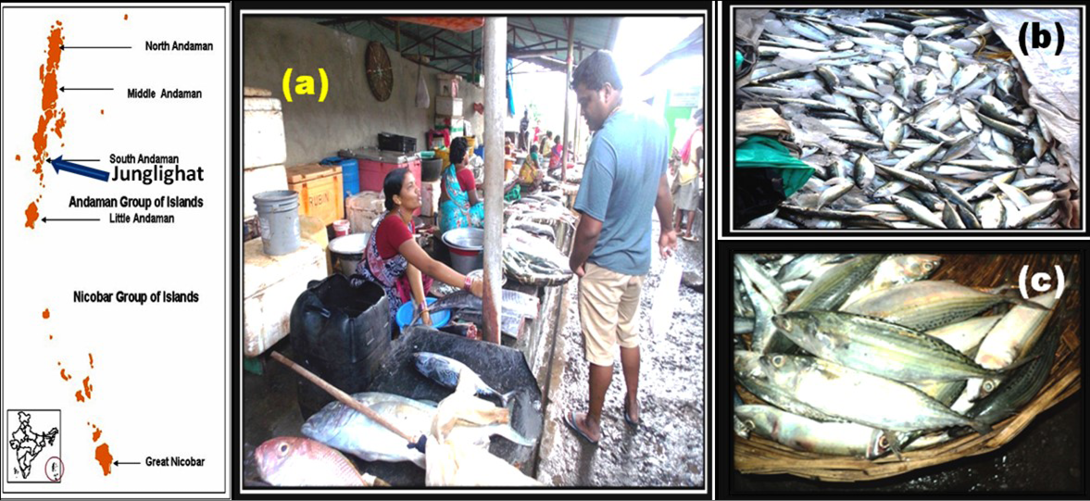
The present study was carried out based on the samples of Indian Mackerel (R. kanagurta) collected from Junglighat fish market of South Andaman (Figure 1). The freshly collected fish samples were transported in an ice box aseptically to the laboratory for analysis. The raw fish samples were stored at room temperature (28°C) for 5 hours, ice for 24 hours and in refrigerator (-4°C) for 5 days following (Okaro et al., 2010).
The conventional method of sensory analysis (Krendorf et al., 1979; Huss, 1995; Dainty, 1996) was used to evaluate the quality of the fish. The characteristic features of the fish such as colour of eyes, skin and colour of gills were observed. Odour and texture of the tissue and development of slime on the surface were also observed. pH of the fish was determined by the method of Waller (1980). 10 grams of fish sample were homogenized with 50 ml of distilled water and the pH value of homogenate measured by using a glass electrode pH meter.
Bacterial count on external surfaces, intestine, gill and tissue were done following (Okaro et al., 2010). A sterile cotton swab was dipped into 0.10% (W/V) sterile peptone water and was robbed over the surface of fish area. The swab was immediately placed into sterile sample bottle containing 100 ml of 0.10% (W/V) peptone water. Peptone was vigorously shaken for 10 minutes and allowed to stand for 20 minutes. Seven folds of Serial dilutions of bacterial suspension in peptone water were prepared in duplicate and viable aerobic bacterial count was enumerated in nutrient agar after incubation at 37°C for 48 hours.
A total of 10 grams each of tissue samples from intestine, gills and muscle were dissected out, blended and mixed properly in a mortar and pestle. It was aseptically transferred to the container with 90 ml of freshly prepared 0.10% sterile peptone water. The bottle was closed and shaken thoroughly for 10 min and allowed to stand for 20 minutes. Then serial dilution was carried out in duplicate and viable bacterial count was enumerated in nutrient agar after incubation in incubator at 37 °C for 48 hours. Bacterial colonies were counted by using digital colony counter.
RESULTS
Quality Assessment of Raw Rastrelliger kanagurta (28°C)
During the 1st hour of this experiment, it was observed that skin less bright in colour, eyes clear and normal, gills reddish, belly stiff and the fish smelled fishy (Table 1).
Table 1: Sensory analysis of raw Rastrelliger kanagurta (28°C)
|
Body part |
Observations |
||||
|
1st hour |
2nd hour |
3rd hour |
4th hour |
5th hour |
|
|
Skin |
Less bright |
Dull bright |
Dull bright |
Dull bright |
Dull bright |
|
Eyes |
Clear & Normal |
Clear & Normal |
Clear & Normal |
Clear & Normal |
Cloudy & Normal |
|
Gill |
Reddish |
Reddish |
Brownish Red |
Brownish Red |
Brownish Red |
|
Belly |
Stiff |
Stiff |
Stiff |
Elastic |
Soft |
|
Odour |
Fishy odour |
Fishy odour |
Neutral |
Neutral |
Neutral |
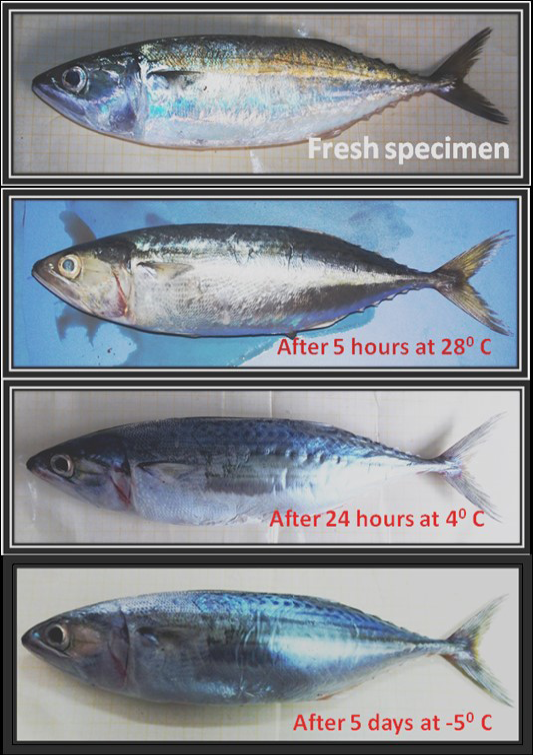
While in the 2nd hour all features found to be constant except for dull bright colour of skin. The gill colour changed to Brownish red and overall smell was neutral at 3rd hour of the experiment. The belly character changed to elastic during 4th hour. During the 5th hour, the eyes became cloudy and normal and belly became soft in nature (Figure 2).
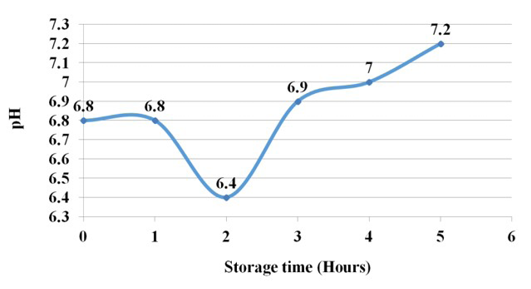
The pH during the 1st hour decreased in the 2nd hour a little and then shown steady increase and reached 7.2 at 5th hour of experiment. This shows a change from the acidic pH of the tissue to a slightly alkaline pH (Figure 3).
The total variable count of bacterial population in the slime was 1.7x10⁴ in the 1st hour, which decreased to the lowest of 1.4x10⁴ in the 2nd hour and increased to a maximum of 2.8x10⁴ and then decreased to 1.8x10⁴ in the 5th hour (Table 2). While the total variable count of bacterial population in the gills was 3.2x10⁴ in the 1st hour, which increased to 4.6x10⁴ in the 2nd hour, decreased to the minimum of 2.8x10⁴ in the 3rd hour and increased 7.8x10⁴ in the 5th hour. The total variable count of bacterial population in the intestine of raw fish sample was 6.7x10⁴ in the 1st hour which increased to 11.2x10⁴ in the 5th hour. Whereas the bacterial population in the tissue was 3.4x10⁴ in the 1st hour, which decreased to 2.9x10⁴ in the 2nd hour and increased to 4.7x10⁴ in the 4th hour but finally decreased to 4.2x10⁴ in the 5th hour.
Table 2: Total variable count of bacterial population from raw Rastrelliger kanagurta (28°C)
|
Body part |
Storage Time |
||||
|
1st hour |
2nd hour |
3rd hour |
4th hour |
5th hour |
|
|
Slime (CFU/cm2) |
1.7x10⁴ |
1.4x10⁴ |
2.8x10⁴ |
2.4x10⁴ |
1.8x10⁴ |
|
Gill (CFU/gm) |
3.2x10⁴ |
4.6x10⁴ |
2.8x10⁴ |
6.2x10⁴ |
7.8x10⁴ |
|
Intestine (CFU/gm) |
6.7x10⁴ |
7.2x10⁴ |
8.2x10⁴ |
10.6x10⁴ |
11.2x10⁴ |
|
Tissue (CFU/gm) |
3.4x10⁴ |
2.9x10⁴ |
3.2x10⁴ |
4.7x10⁴ |
4.2x10⁴ |
Quality Assessment of Iced Rastrelliger kanagurta (4°C)
During the 1st hour of this experiment, it was observed that skin was bright in colour, eyes were clear and normal, gills were reddish, belly stiff and the fish smelled fishy (Table 3). While in the 6th hour all other characters shown no change except for less bright colour of skin and gill colour changed to brownish red. The eye changed to dull and plain and overall smell was neutral at 12th hour of the experiment. The belly ruptured during 18th hour. During the 24th hour, the eyes became shrunken and the odour become rancid (Figure 2).
Table 3: Sensory analysis of iced Rastrelliger kanagurta (4°C)
|
Body part |
Storage Time |
||||
|
1st hour |
6th hour |
12th hour |
18th hour |
24th hour |
|
|
Skin |
Bright |
Less bright |
Dull bright |
Dull bright |
Dull bright |
|
Eyes |
Clear, normal |
Clear, normal |
Dull & Plain |
Dull & Plain |
Shrunken |
|
Gill |
Reddish |
Brownish red |
Brownish red |
Dull brown |
Dull brown |
|
Belly |
Stiff |
Stiff |
Stiff |
Burst |
Burst |
|
Odour |
Fishy odour |
Fishy odour |
Neutral |
Neutral |
Rancid |
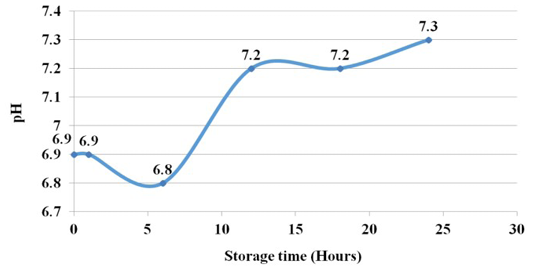
The pH of raw fish during the 1st h decreased in the 6th h a little and then shown steady increase and reached 7.5 at 24th h of experiment. This shows a change from the acidic pH of the tissue to a slightly alkaline pH (Figure 4).
In the case of iced fish, the total variable count of bacterial population in the slime was 2.8x10⁴ in the 1st hour, which decreased to 2.5x10⁴ in the 12th hour and increased to 3.6x10⁴ in the 18th hour and finally decreased to 2.4x10⁴ in 24th hour (Table 4). The bacterial population in the gill was 4.6x10⁴ in the 1st hour, which decreased to 2.4x10⁴ in the 6th hour, then increased to 4.6x10⁴ in the 18th hours respectively and finally decreased to 3.6x10⁴ in the 24th hour. The bacterial population in the intestine was 9.2x10⁴ in the 1st hour, 4.8x10⁴ in the 12th hours respectively and increased to 9.8x10⁴ in the 24th hour. While, the bacterial population in the tissue was 3.8x10⁴ in the 1st hour, which gradually increased to 6.9x10⁴ in the 24th hours.
Table 4: Total variable count of bacterial population from iced Rastrelliger kanagurta (4°C)
|
Body parts |
Storage Time |
||||
|
1st hour |
6th hour |
12th hour |
18th hour |
24th hour |
|
|
Slime (CFU/cm2) |
2.8x10⁴ |
2.6x10⁴ |
2.5x10⁴ |
3.6x10⁴ |
2.4x 10⁴ |
|
Gill (CFU/gm) |
4.6x10⁴ |
2.4x10⁴ |
2.8x10⁴ |
4.6x10⁴ |
3.6x 10⁴ |
|
Intestine (CFU/gm) |
9.2x10⁴ |
7.6x10⁴ |
4.8x10⁴ |
8.2x10⁴ |
9.8x 10⁴ |
|
Tissue (CFU/gm) |
3.8x10⁴ |
4.2x10⁴ |
5.6x10⁴ |
6.2x10⁴ |
6.9x 10⁴ |
Quality Assessment of Frozen Rastrelliger kanagurta (-5°C)
During the 1st day of this experiment, it was observed that skin was bright in colour, eyes were clear and normal, gills were reddish, belly stiff and the fish smelled fishy (Table 5). While in the 2nd day the skin colour changed to dull bright and eyes became shrunken and transparent. The gill colour changed to brown and overall smell was neutral at 3rd day of the experiment. The belly became non-elastic during 4th day and impressions remained after pressing. During the 5th day, the eyes became cloudy (Figure 2).
Table 5: Sensory analysis of frozen Rastrelliger kanagurta (-5°C)
|
Body parts |
Storage Time |
||||
|
1st day |
2nd day |
3rd day |
4th day |
5th day |
|
|
Skin |
Bright |
Dull bright |
Dull bright |
Dull |
Dull |
|
Eyes |
Clear & Normal |
Shrunken |
Shrunken |
Cloudy |
Cloudy |
|
Gill |
Reddish |
Brownish Red |
Brown |
Dull brown |
Discolour |
|
Belly |
Stiff |
Soft |
Im- pression |
Im- pression |
Im- pression |
|
Odour |
Fishy odour |
Fishy odour |
Neutral |
Neutral |
Rancid |
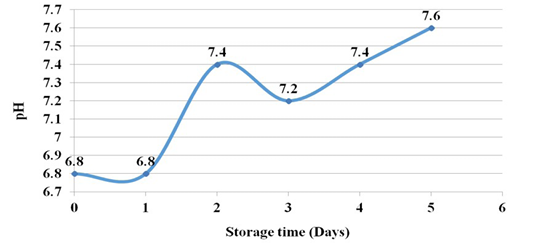
The pH of raw fish during the 1st day increased in the 2nd day a little and then shown steady increase and reached 7.6 at 5th day of experiment. This shows a change from the acidic pH of the tissue to a slightly alkaline pH (Figure 5).
The bacterial population in the slime have shown an increasing trend from 2.8x10⁴ in the 1st day to 7.2x10⁴ on the 5th day (Table 6). In the gills, the bacterial population was 4.6x10⁴ on the 1st day, which decreased to the lowest of 4.5x10⁴ on the 2nd day and shown the highest of 8.8x10⁴ on the 3rd day and finally reached 7.6x10⁴ on the 5th day. While in the intestine it was 9.2x10⁴ on the 1st day, decreased to the lowest of 5.6x10⁴ on 2nd day and increased to the highest of 16.4x10⁴ on the 5th day. In the tissue, on the 1st day the count was 3.8x10⁴ which decreased to 2.8x10⁴ on 2nd day and finally increased to 6.1x10⁴ on 5th day.
Biochemical tests were performed to identify the bacteria isolated from the fish on the basis of carbohydrate fermentation abilities till the stage of spoilage under various storage conditions. The bacterial species isolated from the various parts of R. kanagurta during the study were Lactobacillus acidophilus, Bacillus subtilis, Bacillus cereus, Staphylococcus sp., Psuedomonas sp., Flavobacter sp., E.coli, Micrococcus sp., Streptococcus sp., Vibrio sp., Acinetobacter sp., Flavorbacter sp., Klebsiella sp., Proteus vulgaris, Vibrio cholerae, Vibrio parahaemolyticus, Acinetobacter sp., Aeromonas sp. and Shigella sp. (Table 7, 8 and 9).
Table 6: Total variable count of bacterial population from of frozen Rastrelliger kanagurta (-5°C)
|
Body parts |
Storage Time |
||||
|
1st day |
2nd day |
3rd day |
4th day |
5th day |
|
|
Slime (CFU/cm2) |
2.8x10⁴ |
4.2x10⁴ |
4.8x10⁴ |
6.2x10⁴ |
7.2x10⁴ |
|
Gill (CFU/gm) |
4.6x10⁴ |
4.5x10⁴ |
8.8x10⁴ |
7.2x10⁴ |
7.6x10⁴ |
|
Intestine (CFU/gm) |
9.2x10⁴ |
5.6x10⁴ |
12.6x10⁴ |
13.6x10⁴ |
16.4x10⁴ |
|
Tissue (CFU/gm) |
3.8x10⁴ |
2.8x10⁴ |
4.9x10⁴ |
4.6x10⁴ |
6.1x10⁴ |
DISCUSSION
The responsibility of food safety and quality is placed on food business operators and those operating fish businesses must carry out organoleptic examinations to ensure that fishery products comply with food quality and safety criteria (Farid, 1991; Frederiksen, 2002). According to Huss (1995), changes that occur between capture and consumption of fish can be put into three stages viz:
(1) The pre region state in which the muscle tissue in soft and pliable.
(2) The stiff and rigid condition known as rigor mortis whose onset can occur between 1-24 hours after death depending upon the fish species.
(3) Post region state the fish become softened and start to deteriorate.
Table 7: Bacterial species composition at each stage of spoilage at (28°C)
|
Time (hrs) |
External |
Tissue |
Gills |
Intestine |
|
0 |
Bcillus cereus, Lactobacillus acidophilus, Bacillus subtilis |
Bacillus subtilis, Staphylococcus sp. |
Psuedomonas sp., Flavobacter sp., Staphylococcus sp. |
E. coli, Bacillus sp., Micrococcus sp., Streptococcus sp., Staphylococcus sp. |
|
1 |
Proteus sp., Bacillus cereus, Lactobacillus acidophilus, Bacillus subtilis |
Bacillus subtilis, Streptococcus sp., Acinetobacter sp. |
Pseudomonas sp., Streptococcus sp., Flavobacter sp., Staphylococcus sp. |
E. coli, Bacillus sp., Lactobacillus sp., Micrococcus sp., Streptococcus sp., Staphylococcus sp. |
|
2 |
Enterobacter sp., Pseudomonas, Micrococcus sp., Bacillus subtilis, E.coli |
Pseudomonas sp., Bacillus subtilis, Micrococcos sp. |
Psuedomonas sp., Streptococcus sp., Flavobacter sp. |
E. coli, Bacillus sp., Lactobacillus sp., Micrococcus sp., Streptococcus sp., Staphylococcus sp. |
|
3 |
E.coli, Pseudomonas sp., Micrococcus sp., Acinetobacter sp., Planococcus sp. |
Pseudomonassp, Bacillus subtilis, Micrococcus sp. |
Psuedomonassp,, Streptococcus sp., Flavobacter sp. |
E. coli, Bacillus sp., Vibrio cholerae, Micrococcus sp., Streptococcus sp., Staphylococcus sp., Klebsiella sp. |
|
4 |
Pseudomonas, Proteus vulgaris, E. coli, Salmonella sp., Klebsiella sp. |
Pseudomonas, Bacillus subtilis, Vibrio sp. |
Vibrio sp., Bacillus sp., Staphyococcus sp. |
Vibrio parahaemolyticus, E. coli, Bacillus sp., Vibrio cholerae, Micrococcus sp., Streptomyces sp. Staphylococus sp., Salmonella sp. |
|
5 |
Pseudomonas sp., Proteus vulgaris, Vibrio sp. Salmonella sp. |
Pseudomonas, Bacillus subtilis, Flavobacter sp. |
Vibrio sp., Bacillus sp., Staphylococcus sp. |
E. coli, Vibrio parahaemolyticus, Pseudomonas sp., Acinetobacter sp., Staphylococus sp. |
Table 8: Bacterial species composition at each stage of spoilage at (4°C)
|
Time (hrs) |
External |
Tissue |
Gills |
Intestine |
|
0 |
E.coli, Pseudomonas sp., Lactobacillus acidophilus, Bacillus subtilis, Vibrio cholerae |
Bacillus subtilis, Staphylococcus sp. |
Psuedomonas sp., Flavobacter sp., Staphylococcus |
E.coli, Bacillus sp., Micrococcus sp., Streptococcus sp., Staphylococcus sp. |
|
1 |
Pseudomonas sp, Lactobacillus acidophilus, Bacillus subtilis, Proteus vulgaris |
Bacillus subtilis, Staphylococcus sp., Proteus vulgaris |
Psuedomonas sp, E. coli, Flavobacter sp., Staphylococcus, Klebsiella sp. |
E.coli, Salmonella sp., Micrococcus sp., Streptococcus sp., Staphylococcus sp. |
|
6 |
Bacillus sp, Pseudomonas sp, Micrococcus sp, Acinetobactersp |
Pseudomonas, Shigella sp., Bacillus subtilis,Vibrio sp., Salmonella sp. |
Salmonella sp., Micrococcus sp., Streptococcus sp., Staphylococcus sp., E. coli, |
E. coli, Bacillus cereus., Micrococcus sp., Streptococcus sp., Staphylococcus sp. |
|
12 |
E. coli, Bacillus, Pseudomonas sp., Proteus vulgaris, Aeromonas sp., Vibrio cholerae |
E. coli, Bacillus subtilis, Vibrio sp., Salmonella sp., Clostridium sp. |
E. coli, Bacillus cereus., Enterobacter sp., Streptococcus sp., Staphylococcus sp. |
E. coli, Proteus vulgaris, Bacillus amyloliquefaciens, Shigellaflaxineri, Vibrio sp. |
|
18 |
Bacillus sp., Pseudomonas sp., Proteus vulgaris, shigella sp., E. coli, Vibrio sp., |
Pseudomonas sp., Bacillus subtilis, Vibrio sp., Shigella, Salmonella, Streptococcos, |
Pseudomonas sp, Vibrio sp, Bacillus sp., Proteus sp. |
Clostridium sp., Salmonella sp., Coliforms, Vibrio sp., Klebsiella sp. |
|
24 |
E.coli, Pseudomonas sp., Proteus vulgaris, Psuedomonas sp., Streptococcus sp., Staphylococcus sp.Yersinia sp. |
Pseudomonas sp., Bacillus subtilis, Vibrio sp. Shigella sp., Salmonella sp., |
Vibrio sp., Bacillus sp., Psuedomonas sp., Streptococcus sp.,Vibrio cholerae |
E. coli, Bacillus sp.,Vibrio sp., Micrococcus sp., Shigella sp., Aeromonas sp., Salmonella sp. |
Table 9: Bacterial species composition at each stage of spoilage at (-5°C)
|
Time (Day) |
External |
Tissue |
Gills |
Intestine |
|
0 |
Pseudomonas, Bacillus subtilis, Vibrio cholerae, Salmonella sp. |
Bacillus subtilis, Staphylococcus |
Proteus vulgaris, Flavobacter sp., Staphylococcus sp., |
E.coli, Bacillus sp., Streptococcus sp., Staphylococcus sp.,Vibrio sp. |
|
1 |
Bacillus cereus, Proteus vulgaris, Vibrio sp., Shigella sp., Salmonella sp. |
Bacillus subtilis, Bacillus cereus, Staphylococcus sp., Streptococcus sp. |
Vibrio sp, Bacillus cereus, Staphylococcus sp. Streptococcus sp. E. coli, Klebsiella sp. |
E. coli, Bacillus sp., Streptococcus sp., Staphylococcus sp, Vibrio sp. |
|
2 |
Bacillus sp., Proteus sp., Staphylococcus sp., Streptococcus sp. E. coli, |
Pseudomonas sp., Bacillus subtilis, Vibrio sp., Shigella sp., Salmonella sp. |
Vibrio sp., Bacillus sp., Planococcus sp., Staphylococcus sp., Streptococcus sp. |
E. coli, Bacillus sp., Vibrio parahaemolyticus, Streptococcus sp., Staphylococcus sp., Shigella sp., Salmonella sp. |
|
3 |
E. coli, Pseudomonas, Proteus vulgaris, Vibrio sp, Staphylococcus sp., Streptococcus sp. |
Pseudomonas sp., Bacillus cereus, Staphylococcus sp., Streptococcus sp., Bacillus subtilis, Vibrio sp. Shigella sp., Salmonella sp. |
Vibrio sp., Bacillus sp., Staphylococcus sp., Streptococcus sp., Enterobacter sp. |
Psuedomonas sp. E. coli, Vibrio fishery, Vibrio cholerae, Aeromonas sp., Acinetobacter sp., Enterobacter sp. Staphylococcus sp., Streptococcus sp. |
|
4 |
Pseudomonas, Proteus vulgaris, Enterobacer sp. Staphylococcus sp., Streptococcus sp. |
Pseudomonas sp., Bacillus subtilis, Vibrio sp. Shigella sp., Salmonella sp. |
Enterobacter sp., Vibrio sp., Bacillus, Staphylococcus sp., Streptococcus sp. |
Shigella sp., Bacillus subtilis, Salmonella sp., E. coli, Vibrio cholerae, Enterobacter sp., Staphylococcus sp., Streptococcus sp. |
|
5 |
Pseudomonas sp., Proteus sp., Shigella sp., Bacillus subtilis, Vibrio sp., Salmonella sp. |
Pseudomonas sp., Shigella sp., Bacillus subtilis, Vibrio sp., Salmonella sp. |
Vibrio sp., Bacillus cereus, Staphylococcus sp., Streptococcus sp. |
Shigella sp., Bacillus subtilis, Vibrio sp., Salmonella sp., Vibrio cholerae, Aeromonas sp., Acinetobacter sp., Enterobacter sp., Staphylococcus sp., Streptococcus sp. |
Ali et al. (2008) reported that organoleptic evaluation score decreased over the range of time. At ambient temperature storage (28°C) for 5 hours at 1 hourly monitoring interval, the storage life of the fish sample was predicted to be hours, at this stage the fish is still sensorily acceptable (Okaro et al., 2010). The present study has shown that after the five hours of monitoring in 28°C, the fish was still acceptable but shown signs of spoilage. While the bacterial load at the fish surface was 1.8x10⁴ cfu/cm2. The tissue, gills and the intestine had bacterial load of 4.2x10⁴, 7.2x10⁴ and 11.2x10⁴ cfu/g, respectively. The tissue was considered as the reference point for bacterial spoilage because every other part of the fish with the exception of the tissue harbour normal bacterial flora even while the fish is alive. The tissue of a healthy fish is normally considered sterile until bacterial inversion that leads to spoilage. According to (Adams and Moses, 2008), the normal bacterial load of the surface slime of fish can range from 102-107 cfu/cm2 and the Gills and Intestines can range up to 103 and 107 cfu/g respectively. The bacterial load of the R. kanagurta (6.2x10⁴cfu/g) at the predicted shelf life of 12 hours was within the range of the maximum limit (106 cfu/g) recommended by the international commission for microbiological standards of food (ICMSF, 1978, 1998). Lerke and Farber (1969) compared various indices of deterioration of refrigerated fish fillets and concluded that direct bacterial count can be used to predict fish storage life and period of freshness at 5°C. According to Adams et al. (1964), the initial load of microbial spoilers will be below 10%, which rose towards an average value and again declined both organoleptically and chemically in fish.
At iced temperature (4°C), the storage life of the fish sample under investigation was predicted to be 24 hours (Okaro et al., 2010). In the present study, the results have shown that the fish was still acceptable based on the sensory standards and the bacterial load of 6.9x10⁴ cfu/g the fish tissue was which was still within the recommended maximum limit for acceptability (ICMSF, 1978). The shelf life of most marine fishes at iced temperature (4°C) can last up to 24 hours but this depends on the fish species, oil level of the fish tissue, catch area, intrinsic conditions of the fish and how it was handled since capture. Surendran et al. (1989) reported that the acceptable iced storage shelf life of Indian Mackerel is nearly one week based on bacterial count.
At freezing temperature (-5°C), the storage life of the fish sample was predicted to be 5 days and this was based mainly on the sensory and microbiological evaluation which were within the recommended maximum limits of acceptability. Huss (1995) stated that super chilling at -4°C can effectively prolong the shelf life of fish upto 5 days because at such temperature, microbial spoilage is very unlikely but rather chemical and enzymatic changes leads to spoilage. This assertion was also corroborated by Adams and Moses (2008) that microbial spoilage is very unlikely at frozen storage. In the present study, at frozen temperature (-5°C), the microbial load of the fish sample was as low as 6.1×10⁴ cfu/g. While an analysis of bacterial species present or added to the microbial flora in the skin, tissue and intestine have not shown any significant difference in respect to time, but differed significantly between various body parts analysed. The sensory and microbiological analyses are found to be more reliable in many marine fishes than the chemical approach by many researchers (Surendran et al., 1989; Huss, 1995; Mhongole, 2009; Okaro et al., 2010). Conclusively, the shelf life of R. kanagurta captured and marketed in Andaman at ambient (28°C) and iced (4°C) temperatures was 5 hours and 24 hours respectively and the results of sensory and microbiological analysis were all in agreement with the recommended international limits for acceptability for consumption.
ACKNOWLEDGEMENTS
Authors are thankful to Pondicherry University & Director, ICAR-Central Island Agricultural Research Institute, Port Blair and for the facilities provided during the period of study.
CONFLICT OF INTERESTS
The authors have no conflict of interest exist related to this manuscript.
AUTHORS’ CONTRIBUTION
Sumitha Gopalakrishnan, Mothilal Mudavath and Ravi Ranjan Kumar were involved in the sampling, experiments and data analysis. Dr. Jai Sunder and Dr. Venu Sasidharan provided necessary guidance to the students, analysis and writing of the manuscript.
REFERENCES


