Advances in Animal and Veterinary Sciences
Research Article

Optimization and Validation of a Diagnostic Real-Time PCR for Specific Detection of Mycobacterium avium Subspecies Paratuberculosis
Bonda Rama Lakshmi2a, 3, Falguni Mukherjee1a, Kota Sri Naga Leela Surendra1, Vijay Shriram Bahekar1, Amitesh Prasad1, Samir Kumar Rana1, Kommoju Nagmani3, Ponnanna Nadikerianda Muthappa1, Girish Kumar Sharma4, Villuppananooralwar Srinivasan5*
1National Dairy Development Board, R&D Laboratory, Hyderabad, 500032, Telangana, India; 2Department of Biotechnology, Acharya Nagarjuna University, Guntur, 522510, Andhra Pradesh, India; 3Research and Development Center, Indian Immunologicals Limited, Hyderabad, 500032, Telangana, India; 4National Dairy Development Board, Anand, 388001, Gujarat, India; 5National Dairy Development Board, Animal Health,Gachibowli, Hyderabad 500032, Telangana, India.
Abstract | A diagnostic Real time PCR (qPCR) for detection of Mycobacterium avium subspecies paratuberculosis (MAP) was optimized using the ISMav2 sequence specific for MAP. The analytical sensitivity of the assay was 500 fg, and it was able to detect approximately 7 copies of the positive control plasmid construct. The qPCR detected up to 1x10³, 1x10⁴ and 1x 10⁵ MAP cells per reaction from spiked bovine semen, milk and feces respectively. The assay was reliable, reproducible and could be completed in 87 minutes. Comparative quantification for MAP copy number was established by utilizing normalized Cq values. The ISMav2 qPCR specifically detected 8 MAP strains, but was unable to amplify DNA from any other strains of Mycobacterium (n=5) or non-Mycobacterium strains (n=10). Several factors were tested to study their impact on the validation of the assay under field conditions. It was observed that sample size, number of sampling time points and test methods adopted for accepting the infection status were strongly correlated. The best return of validation estimates were obtained when sample-wise results of the qPCR were compared to the combined status of culture and acid fast bacilli (AFB) staining. The diagnostic sensitivity and specificity, positive and negative predictive values were estimated to be 100% (95% CI |63.06 -100.0|) and 99.9% (95% CI |99.44 100.0|), 88.89% (CI |51.75 -99.72|) and 100% (95%CI |99.75 -100.0|), respectively. Also, the qPCR and the MAP identification test conditions were strongly associated (κ = 0.941 (95% CI |0.825 – 1.00|). The validation estimates were true only when the sample size was large (n=1008) and sample collection was based on a single time point sampling strategy. Thus it appears that the assay could be considered as a reliable and rapid diagnostic test for field application.
Keywords | Johne’s disease, ISMav2, IS900, qPCR
Editor | Kuldeep Dhama, Indian Veterinary Research Institute, Uttar Pradesh, India.
Received | October 30, 2015; Revised | November 17, 2015; Accepted | November 18, 2015; Published | December 01, 2015
*Correspondence | Villuppananooralwar Srinivasan, National Dairy Development Board, Telecom Nagar, Gachibowli, Hyderabad, India; Email: srinivasanva1948@gmail.com
aThese authors contributed equally to this work.
Citation | Lakshmi BR, Mukherjee F, Surendra KSNL, Bahekar VS, Prasad A, Rana SK, Nagmani K, Muthappa PN, Sharma GK, Srinivasan V (2016). Optimization and validation of a diagnostic real-time PCR for specific detection of Mycobacterium avium subspecies Paratuberculosis. Adv. Anim. Vet. Sci. 4(1): 12-24.
DOI | http://dx.doi.org/10.14737/journal.aavs/2016/4.1.12.24
ISSN (Online) | 2307-8316; ISSN (Print) | 2309-3331
Copyright © 2016 Lakshmi et al. This is an open access article distributed under the Creative Commons Attribution License, which permits unrestricted use, distribution, and reproduction in any medium, provided the original work is properly cited.
INTRODUCTION
Johne’s disease is caused by Mycobacterium avium subspecies paratuberculosis (MAP) (OIE, 2014). MAP is a facultative intracellular acid fast bacillus, which affects domestic ruminants such as cattle, sheep, goats and wild life such as deer, antelope and bison; and impact on dairy and beef industry in terms of decreased milk production, increased cow replacement and shorter life expectancy of animals (Ayele et al., 2001; Delgado et al., 2011). MAP infections primarily target the intestinal tract, developing as chronic granulomatous enteritis and manifested clinically by emaciation and diarrhea (Manning, 2011; Forde et al., 2013).
Isolation of MAP by culture is considered as a ‘Gold standard’ (Collins et al., 2005; Clark et al., 2008). However, culture on solid media is time consuming, and at least 8-16 weeks of incubation is required for growth and identification of MAP (Giese and Arhnes, 2000; Selim et al., 2013), although liquid culture is more sensitive and quicker. PCR has proven to be sensitive and specific detection method for identification of MAP in milk and clinical samples (Giese and Arhnes, 2000; Grant et al., 2000; Corti et al., 2002; Pillai and Jayarao, 2002; Rhodes et al., 2003). A number of genes and sequences unique to MAP have been identified over the years. The IS900, insertion sequence is a 1451bp segment that lacks inverted terminal repeats and is repeated 15-20 times in the MAP genome (Khare et al., 2004; Stabel and Bannantine, 2005; Vijayarani et al., 2009). However PCR based on IS900 may not be specific for MAP as IS900 like elements may be present in other closely related mycobacteria (Cousins et al., 2000; Harris and Barletta, 2001; Stina et al., 2002; Bolske et al., 2002; Vansnick et al., 2004). Because of the false positive result of PCR targeting IS900 element, alternative genetic elements including the ISMav2 sequence have been evaluated to improve the specificity and reliability of MAP detection by PCR. The MAP specific ISMav2 is found in at least 3 copies, and it has no similarity with other Mycobacterium IS elements (Strommenger et al., 2001; Stratmann et al., 2006; Schonebrucher et al., 2008; Debroy et al., 2012; Selim et al., 2013).
In this study we attempted the optimization, normalization and validation of a quantitative real time PCR for detection of MAP infection in bovines under the different clinical setting in India targeting the ISMav2 sequence as there is paucity of information on comprehensive validation of quantitative real time diagnostic PCR on a full range of clinical samples from bovines (Khare et al., 2004; Stratmann et al., 2005; Schonebrucher et al., 2008; Plain et al, 2014). Also various sampling and disease identification strategies were adopted to include most of the different clinical conditions, in order to test the appropriate method, for determining the validity of the diagnostic estimates of the MAP specific qPCR.
MATERIALS AND METHODS
Sampling Strategy and Source of Samples
Two strategies were used for collection of samples. The sample size and the number of times samples were collected formed the core of each strategy. Samples were collected either at a single time point or at a multiple time points from the same animal. Using a large sample size (n=1008) and single time point sampling strategy (STPS) feces (n=381), milk (n=605) and post-mortem tissues (n=22) were collected from fields and farms of 3 different geographical regions of India (Table 1). The sampling strategy under STPS on large sample size was defined as ‘Approach 1’ in this study.
Table 1: Region-wise and specie-wise distribution of field samples originated from three different states of India, processed for Identification of MAP
|
State |
Species |
Type of Sample |
||
|
Feces |
Milk |
Tissue |
||
|
Telangana |
Cattle |
67 |
148 |
2 |
|
Buffalo |
0 |
0 |
15 |
|
|
Gujarat |
Cattle |
194 |
423 |
0 |
|
Buffalo |
120 |
34 |
0 |
|
|
Maharashtra |
Buffalo |
0 |
0 |
5 |
|
Total (n=1008) |
381 |
605 |
22 |
|
Additionally, the effect due to STPS on smaller size (n varying from 55 to 95) comprising of feces (n=40), milk (n=30) and semen (n=25) was defined as ‘Approach 2’ (Table 4). The effect of multiple time point sampling (MTPS) on small samples (n=95), comprise feces (n=40), milk (n=30) and semen (n=25) was defined as ‘Approach 3’ (Table 5). The samples for Approach 2 and 3 were collected from 2 farms in Gujarat.
Source and Maintenance of the Reference and Field Strains of Bacteria and Virus
The bovine isolate Mycobacterium avium subspecies paratuberculosis (MAP) strain K-10 (ATCC Number- BAA-968) was used throughout this study as the reference strain. MAP was grown in Middlebrook 7H9 broth (BD) supplemented with ADC (Albumin dextrose complex -BD), 0.05% Tween 80 and Mycobactin J @ 2mg/L (Synbiotics Europe SAS, Lyon, France). For viability counts MAP was cultured on HEYM (Hi-media) and Middlebrook 7H10 Agar (BD, U.S.A). The details of the strains used in this study are furnished in Table 3. Brucella strains were maintained according to the standard protocol (Alton et.al., 1988). Yersinia enterolytica O:3 and O:9 were maintained on Brain Heart Infusion Agar (BD,U.S.A) at 28ºC , Vibrio cholera O:1 Ogawa and Inaba strains were grown in Terrestrial Yeast Extract Medium (BD,U.S.A) at 25ºC. Agrobacterium spp. was maintained in Yeast Extract broth (made in house) at 28oC overnight. E.coli was propagated on Luria Bertani agar (Himedia, India Cat. No. M1245) incubated at 37oC for 24 hours. Bovine herpes virus-1 culture was maintained in MDBK cells (ATCC Cat. No. CCC-22TM) were obtained from the R&D facilities of Indian Immunologicals Limited, Hyderabad, India.
For sensitivity studies the MAP field strains isolated from milk and tissue samples were grown on HEYM medium, and the isolates were further identified by acid-fast staining and ISMav2 conventional PCR (data not shown). The MAP colonies were then suspended in Middlebrook 7H9 broth for preparing suspension of MAP. The MAP cell counts were calculated by measuring the optical density of vortexed MAP cells at 550 nm as described by (Hughes et al., 2001).
Table 2: Details of Primers and Probes used in the ISMav2 qPCR assay for the detection of Mycobacterium avium subsp paratuberculosis in clinical samples
|
Gene Target |
Gen Bank Accession number |
Designation, nucleotide sequence (nt) of primes and probes, position of primers and probes |
Amplicon size (bp) |
Reference |
|
IS900 |
AF416985.1 |
RT-For- 5’TTGGATCGCTGTGTAAGGAC 3’; 160-180 RT-Rev- 5’CGTCATTGTCCAGATCAACC 3’; 222-203 Probe- FAM 5’ CAGCAGACGACCACGCCGAC 3’TAMRA; 202-182 |
62 |
In this study |
|
ISMav2 |
AF286339 |
RT-For- 5’ATCAGATGCTGGCGGTAGT 3’; 1103-1122 RT-Rev- 5’CAACTCGAACACCAACCG 3’; 1192-1174 Probe- FAM 5’ AACTCCAACACCGCCGCCTC 3’TAMRA; 1143-1123 |
89 |
In this study |
|
ISMav2 |
AF286339 |
ISMav1- 5’ GTATCAGGCCGTGATGGCGG 3’; 940-959 ISMav2- 5’ CGCGACCAGCGCTCGATACA 3’; 1248-1233 |
318 |
Stratmann et al., 2002 |
|
HPV-18 L1 |
AY383628.1 |
HPV For: 5’ TGGAGACCATCCGATAACAC 3’; 10-29 HPV Rev: 5’ GGATGTCTTGTTTGTTTCCG 3’ ; 168-187 HPV Probe: FAM 5’TCTGTGTTCACCACCCGGGC 3’ TAMRA; 54-74 |
187 |
In this study |
Table 3: Specificity of the ISMav2 by qPCR
|
Name of the specimen |
Sample type |
Real-time PCR Result |
|
|
ISMav2 gene target (Cq value) |
IS900 gene target (Cq value) |
||
|
Mycobacterium aviumsubspparatuberculosis (K-10) |
Culture |
Positive (14.68) |
9.78 |
|
MAP isolate 1a: Lab ID No. PS-4 |
Tissue |
38.72 |
ND |
|
MAP isolate 2a : Lab ID N0. 4882 |
Tissue |
35.21 |
ND |
|
MAP isolate 3b : Lab ID No. 11728 |
Milk |
38.4 |
ND |
|
MAP isolate 4b : Lab ID No. Jini |
Milk |
37.6 |
ND |
|
MAP isolate 5b : Lab ID No. 11716 |
Milk |
34.74 |
ND |
|
MAP isolate 6b : Lab ID No. 27302425 |
Milk |
36.15 |
ND |
|
MAP isolate 7a : Lab ID No. G115 |
Milk |
37.03 |
ND |
|
MAP isolate 8a : Lab ID No. 151 |
Milk |
37.73 |
ND |
|
Mycobacterium tuberculosis (ATCC-25177) |
Culture |
Negative |
28.5 |
|
Mycobacterium phlei (ATCC-11758) |
Culture |
Negative |
29.2 |
|
Mycobacterium avium (ATCC-700897) |
Culture |
Negative |
29.8 |
|
Mycobacterium bovis (ATCC-35734) |
Culture |
Negative |
28.6 |
|
Mycobacterium smegmatis (ATCC-19420) |
Culture |
Negative |
27.8 |
|
Brucella abortus 544 (ATCC-23448) |
Culture |
Negative |
ND |
|
Brucella abortus (S19) (NDDB) |
Culture |
Negative |
ND |
|
Brucella abortus (RB51) (Virginiatech,USA) |
Culture |
Negative |
ND |
|
Yersenia enterolytica (O:3) (HAU) |
Culture |
Negative |
ND |
|
Yersenia enterolytica (O:9) (HAU) |
Culture |
Negative |
ND |
|
Vibrio cholera Ogawa (NICE) |
Culture |
Negative |
ND |
|
Vibrio cholera Inaba (NICE) |
Culture |
Negative |
ND |
|
Bovin eherpesvirus isolate (NDDB) |
Culture |
Negative |
ND |
|
Agrobacterium tumefacians (ATCC) |
Culture |
Negative |
ND |
|
E. coli (DH5-α) (ATCC) |
Culture |
Negative |
ND |
Negative: > 40 cycles; ND: Not done; aIsolated from the state of Telangana, India; bIsolated from the state of Gujarat, India; ATCC: American Type Culture Collection, USA; HAU: Haryana Agricultural University, Hisar, India; NICE: National Institute of Cholera and Enteric Diseases, Kolkata, India; NDDB: National Dairy Development Board, Anand, India
An optical density of 0.25 at 550 nm was approximately equivalent to 108 organisms/ml (Khare et al., 2004).
Extraction of DNA from Virus, Bacteria and Clinical Samples
Genomic DNA from MAP cells and other Mycobacterium strains was extracted by using MAP Extraction System (Tetra core®) according to protocol of Tetra core kit (Rockville, U.S.A). DNA extraction from Brucella, BHV-1 and other bacteria listed in the Table 3 was performed as per the protocol of QiaAmp Blood Mini Kit (Qiagen, Germany).
Selection of Gene Target, Primers and Taqman Probes
The primer and probe was designed based on the MAP insertion elements ISMav2 and IS900. The primers and TaqMan probe were designed targeting these genes by using software from Genscript (www.genscript.com/tools.html#biology). The primers and probes for the detection of exogenous DNA from the L1 region of Human Papilloma Virus (HPV serotype 18) used for normalization of ISMav2 were available in house. The sequence information of the primers and TaqMan probes used for ISMav2, IS900 and HPV- L1 are provided in Table 2.
Preparation of Plasmid Standards
The fragment ISMav2 was amplified by PCR from the DNA of MAP reference strain K-10 using ISMav2 primers (Stratmann et al., 2002). The 318 bp PCR product was purified and was cloned into Topo vector pCRTM2.1-TOPO® (Topo cloning kit, Invitrogen) as per the manufacturer’s instructions. The resultant plasmid clone was used as standard plasmid construct as internal amplification control (IAC) control standard for the qPCR. Based on the concentration and size of the plasmid construct (PCRTM2.1-TOPO® -MAP-ISMav2), copy number of the plasmid was determined. The following formula was used to obtain copies of DNA/Plasmid from DNA concentration: (amount in ng x 6.022x10²³) / (length in bp x 1x10⁹ng/g x 650 g/ mole of bp). The plasmid standard was serially diluted to achieve a final plasmid copy numbers which ranged from 1x10⁷ to 1x101copy per 5µL.
Optimization of Quantitative Real Time Polymerase Chain Reaction
The reaction was performed in 0.2ml PCR strip-tubes (Qiagen Cat. No. 981005) with a total reaction volume of 25µL which comprises of 12.5µL of master mix (Eurogentec qPCR master mix No ROX Reference: RT- QP2X-03+NR), 10 pico-moles of each primer, 10 pico-moles of probe and 5µL of the template. Serially diluted DNA ranging from 500ng to 0.5fg isolated from K-10 strain was used as a template. Reaction conditions were set as follows: Hold at 50°C for 2 minutes and 95°C for 10mins, followed by cycling at 95°C for 15 seconds and 60°C for 60 seconds for 60 cycles. The real-time PCR assay was performed in Rotor Gene Q Real-time PCR cycler (Qiagen). The DNA extracted from clinical samples of known MAP culture negative and positive animals (milk, feces and semen) were used to determine the ideal cut off cycle quantification (Cq) values. The Cq values obtained from DNA extracted from culture positive MAP isolates were taken into consideration for establishing the true nature of the clinical samples.
Analytical Specificity and Sensitivity
Analytical specificity (ASp) of the assay was determined by performing the qPCR using DNA from various related and unrelated bacterial and virus strains to MAP. Analytical Sensitivity (ASe) of the assay was determined by performing the qPCR on serially diluted DNA isolated from MAP in triplicates.
Repeatability and Reproducibility
The intra-assay repeatability of the assay was determined by performing the assay using serially diluted DNA from MAP ranging from 500ng to 0.5fg in triplicates on same day. Three assays with the same set of DNA on three different days, was analyzed to determine the inter-assay reproducibility of the qPCR.
Studies of Effect of Sample Matrix on Qpcr Assay
Various matrices (phosphate buffered saline pH-7.4, Middlebrook 7H9 broth, bovine milk, feces, semen) were spiked with serially diluted MAP cells to achieve a sample range from 1x10⁷ cells to 1x101 cells per ml in triplicates. DNA from these spiked samples were extracted using MAP Extraction System (Tetra core®, Cat No – TC-9014-100, Rockville, U.S.A) following the manufacturers instruction according to protocol of Tetra core kit. Real-time qPCR was performed for each representative samples in triplicates. The sensitivity of the assay and the effect of the matrix were enumerated from three independent assays performed on MAP cells spiked into different matrices.
Quantification of MAP Genome
In this study, equal quantity of unrelated DNA was spiked into the sample, as exogenous control to normalize the data/values obtained from the qPCR targeting ISMav2. Linearized plasmid DNA containing fragment of L1 gene, Human papilloma virus (HPV serotype 18) was selected as exogenous control, in the qPCR. Three MAP negative sample matrices like milk, Middlebrook 7H9 broth, Phosphate buffered saline (PBS) were spiked with 1x10⁷ cells of MAP strain in duplicates. The same samples were further
Table 4: Validation of ISMav2 Real Time PCR
|
Approach 1. Condition 1: Analysis of data was based on sample-wise treatment employing large sample size. Samples were collected at a single time point and under the first condition data was compared to disease status by culture and AFB staining |
||||||||||||||||
|
Comparison of tests: Culture and AFB staining versus qPCR (n=1008) |
||||||||||||||||
|
Tests |
qPCR Positive |
qPCR Negative |
Total |
Kappa (κ) * 95% CI |
DSe (%) 95% CI1 |
DSp (%) 95% CI1 |
PPv (%) 95% CI1 |
NPv (%) 95% CI1 |
||||||||
|
Culture and AFB staining Positive |
8 |
1 |
9 |
κ = 0.941 ‘very good’ CI |0.825 – 1.00| |
100 CI |63.06 -100.0 |
99.9 CI |99.44 100.0| |
88.89 CI |51.75 -99.72| |
100 CI |99.75 -100.0| |
||||||||
|
Culture and AFB staining Negative |
0 |
999 |
999 |
|||||||||||||
|
Total |
8 |
1000 |
1008 |
|||||||||||||
|
Approach 1. Condition 2. Analysis of data was based on sample-wise treatment. Samples were collected at a single time point and under the second condition data was compared to the combined status of culture, AFB staining and serology |
||||||||||||||||
|
Comparison of tests: Culture, AFB staining and serology versus qPCR (n=1008) |
||||||||||||||||
|
Tests |
qPCR Positive |
qPCR Negative |
Total |
Kappa (κ) * 95% CI |
DSe (%) 95% CI1 |
DSp (%) 95% CI1 |
PPv (%) 95% CI1 |
NPv (%) 95% CI1 |
||||||||
|
Culture, AFB staining and serology Positive |
9 |
6 |
15 |
κ = 0.688 ‘good’ CI |0.484 – 0.893| |
81.82 CI |48.22 -97.72.0| |
99.40 CI |98.6999.78| |
60.0 CI |32.29 -83.66| |
99.80 CI |99.27 -99.98| |
||||||||
|
Culture, AFB staining and serology Negative |
2 |
991 |
993 |
|||||||||||||
|
Total |
11 |
997 |
1008 |
|||||||||||||
|
Approach 2. Condition 1: Analysis of data was based on sample-wise treatment using small or limited sample size. Samples were collected at a single time point and under the first condition data was compared to disease status by culture or serology |
||||||||||||||||
|
Comparison of tests: Culture or serology versus qPCR (n=55) |
||||||||||||||||
|
Tests |
qPCR Positive |
qPCR Negative |
Total |
Kappa (κ) * 95% CI |
DSe (%) 95% CI1 |
DSp (%) 95% CI1 |
PPv (%) 95% CI1 |
NPv (%) 95% CI1 |
||||||||
|
Culture or serology Positive |
1 |
6 |
7 |
κ = 0.134 ‘poor’ CI |-0.206 - 0.474| |
33.33 CI |0.84 -90.57| |
88.46 CI |75.66 -95.65| |
14.29 CI |0.36- 57.87| |
95.83 CI |85.27 -99.49| |
||||||||
|
Culture or serology Negative |
2 |
46 |
48 |
|||||||||||||
|
Total |
3 |
52 |
55 |
|||||||||||||
|
Approach 2. Condition 2: Analysis of data was based on sample-wise treatment using small or limited sample size. Samples were collected at a single time point and under the second condition data was compared to disease status culture and AFB staining (n=95) and serology |
||||||||||||||||
|
Comparison of tests: Culture and AFB staining and serology versus qPCR (n=95) |
||||||||||||||||
|
Tests |
qPCR Positive |
qPCR Negative |
Total |
Kappa (κ) * 95% CI |
DSe (%) 95% CI1 |
DSp (%) 95% CI1 |
PPv (%) 95% CI1 |
NPv (%) 95% CI1 |
||||||||
|
Culture and AFB staining and serology Positive |
1 |
6 |
7 |
κ = 0.163 ‘poor’ CI |-0.173 - 0.499| |
33.33 CI |0.84 -90.57| |
93.48 CI |86.34-97.57| |
14.29 CI |0.36- 57.87| |
97.33 CI |92.03 -99.72| |
||||||||
|
Culture and AFB staining and serology Negative |
2 |
86 |
88 |
|||||||||||||
|
Total |
3 |
92 |
95 |
|||||||||||||
Diagnostic estimates derived from clinical samples: Using large sample size (Approach 1) versus smaller sample size(Approach 2); *Kappa (κ) statistics; 1Diagnostics estimates (Diagnostic sensitivity; Dse; Diagnostic specificity –DSp; PPV- Positive Predictive Value; NPV – Negative Predictive Value) were calculated using online soft wares - QuickCalcsGraphPad (graphpad.com/quickcalcs/kappa1./cfm), and Diagnostic test evaluation –MedCalc (https://www. medcalc.net/tests/diagnostic_test.php), respectively.
spiked with 1 X 10⁷ copies of unrelated, linearized plasmid DNA containing E6 gene of human papillomavirus (HPV). DNA was extracted and assayed for ISMav2 gene and HPV L1 gene by qPCR. The copy numbers of MAP and HPV were calculated by two independent standard curves, and MAP DNA copy numbers were normalized using the copy numbers of HPV DNA. The normalized copy number is the ratio of ISMav2: HPV-18L1 copy numbers for a particular sample. The qPCR for HPV used in this study is an In-house method. The master mix, reaction volume and conditions were same as that of MAP qPCR. Sequence of primers and probe for the HPV
Table 5: Validation of ISMav2 Real Time PCR
|
Approach 3. Condition 1: Analysis of data was based on sample-wise treatment employing small sample size. Samples were collected in October, 2012 and under the condition in which data was compared to disease status by culture |
|||||||||||||
|
Comparison of tests: Culture versus qPCR (n=95) |
|||||||||||||
|
Tests |
qPCR Positive |
qPCR Negative |
Total |
Kappa (κ) * |
DSe (%) 95% CI1 |
DSp (%) 95% CI1 |
PPv (%) 95% CI1 |
NPv (%) 95% CI1 |
|||||
|
Positive |
0 |
0 |
0 |
κ = 0.0 ‘poor’ |
0.0 CI |0.00 -84.19| |
100 CI |96.11- 100| |
Undefineda |
97.89 CI |96.20 -99.74| |
|||||
|
Negative |
2 |
93 |
95 |
||||||||||
|
Total |
2 |
93 |
95 |
||||||||||
|
Approach 3. Condition 2: Analysis of data was based on sample-wise treatment employing small sample size. Samples were collected in January, 2013 and under the condition in which data was compared to disease status by culture |
|||||||||||||
|
Comparison of tests: Culture versus qPCR (n=95) |
|||||||||||||
|
Tests |
qPCR Positive |
qPCR Negative |
Total |
Kappa (κ) * 95% CI |
DSe (%) 95% CI1 |
DSp (%) 95% CI1 |
PPv (%) 95% CI1 |
NPv (%) 95% CI1 |
|||||
|
Culture, AFB staining and serology Positive |
0 |
0 |
0 |
κ = 0.0 ‘poor’ |
0.0 CI |0.0 -36.94| |
100 CI |95.85-100| |
Undefined a |
91.58 CI |84.08 -96.29| |
|||||
|
Culture, AFB staining and serology Negative |
8 |
87 |
87 |
||||||||||
|
8 |
87 |
95 |
|||||||||||
|
Approach 3. Condition 3: Analysis of data was based on sample-wise treatment employing small sample size. Samples were collected in March, 2013 and under the condition in which data was compared to disease status by culture |
|||||||||||||
|
Comparison of tests: Culture versus qPCR (n=95) |
|||||||||||||
|
Tests |
qPCR Positive |
qPCR Negative |
Total |
Kappa (κ) * 95% CI |
DSe (%) 95% CI1 |
DSp (%) 95% CI1 |
PPv (%) 95% CI1 |
NPv (%) 95% CI1 |
|||||
|
Culture or serology Positive |
0 |
0 |
0 |
κ = 0 ‘poor’ |
0.0 CI |0.00 -70.76| |
100 CI |97.07 -100| |
Undefined a |
96.84 CI |91.05 -99.34| |
|||||
|
Culture or serology Negative |
3 |
92 |
95 |
||||||||||
|
Total |
3 |
92 |
95 |
||||||||||
Diagnostic estimates derived from clinical samples: Using small sample size and multiple time point sequential sampling (Approach 3); *Kappa (κ) statistics and 1Diagnostics estimates (Diagnostic sensitivity – Dse; Diagnostic specificity –DSp; PPV- Positive Predictive Value; NPV – Negative Predictive Value) were calculated using online soft wares - QuickCalcsGraphPad (graphpad.com/quickcalcs/kappa1./cfm), and Diagnostic test evaluation - MedCalc (https://www.medcalc.net/tests/diagnostic_test.php), respectively.
L1gene qPCR is provided in Table 2.
Estimation of Diagnostic Sensitivity and Specificity
As mentioned above (Sampling strategy and source of samples), three approaches were adopted for estimating the diagnostic sensitivity (DSe) and specificity (DSp). Each approach, and the conditions within approaches, was considered as individual models for testing the fitness and validity of the diagnostic qPCR.
Approach 1: Analysis of data was based on sample-wise treatment. Samples were collected at single time point. Sets of 2x2 contingency tables were generated for comparison of results. Under the first condition/ instance the data was compared to disease status by culture and AFB staining. Under the second condition/ instance the data was compared to the combined status of culture, AFB stating and serology. A sample was considered positive for MAP if it was either detected by culture, AFB staining or serology. In both instances the samples (n=1008) considered for analysis comprised of feces, milk and tissues originated from 834 cattle and 174 buffaloes from the three states of India (Telangana, Maharashtra and Gujarat). Culture and identification of clinical samples as MAP was according to the protocol for BACTEC 960 MGIT tubes from BD, USA (Cat.No: 245154). Prior to inoculation in MGIT tubes milk, tissues and fecal samples were decontaminated according to the protocols of Gao et al. (2005) and Kent and Kubica (1985), respectively; while fecal samples were processed as per manufacturers’ instructions (Para TB MGIT, BACTEC 960TM, BD, USA). For serological screening for antibodies to MAP, a commercial ELISA kit (IDEXX –Mycobacterium paratuberculosis Antibody test kit. Ref.
Table 6: Effect on diagnostic estimates due to variations in sample size, sampling pattern and adopted criteria for diagnosis of disease status
|
Test conditionsa |
Approach 1 Condition 1 (A1 C1) (n =1008) |
Approach 1 Condition 2 (A1 C2)(n=1008) |
Approach 2 Condition 1 (A2 C1) (n=55) |
Approach 2 Condition 2 (A2 C2 (n=95) |
Approach 3 Condition 1 (A3 C1) (n=95) |
Approach 3 Condition 2 (A3 C2) (n=95) |
Approach 3 Condition 3 (A3 C3) (n=95) |
|
Diagnostic estimatesb |
|||||||
|
DSe (%) |
100 |
81.2 |
33.33 |
33.33 |
0 / Undefined |
0/ Undefined |
0/Undefined |
|
DSe change (%) A1 C1:: A1 C2; A2 C1:: A2 C2; A3 C1:: A3 C2:: A3 C3 |
A1 C1:: A1 C2 = 18.8 |
A2 C1:: A2 C2 = 0 No change |
A3 C1:: A3 C2:: A3 C3 = 0 / Undefined. Changes in DSe cannot be calculated using this approach |
||||
|
DSp (%) |
99.9 |
99.4 |
88.46 |
93.48 |
100 |
100 |
100 |
|
DSp change (%) A1 C1:: A1 C2; A2 C1:: A2 C2; A3 C1:: A3 C2 :: A3 C3 |
A1 C1:: A1 C2 = 0.5 |
A2 C1:: A2 C2 = 4.88 |
A3 C1:: A3 C2:: A3 C3 = 0.0 No change |
||||
|
PPv (%) |
88.89 |
60.0 |
14.29 |
14.29 |
0 / Undefined |
0/ Undefined |
0/Undefined |
|
PPv change (%) A1 C1:: A1 C2; A2 C1:: A2 C2; A3 C1:: A3 C2:: A3 C3 |
A1 C1:: A1 C2 = 28.89 |
A2 C1:: A2 C2 = 0 No change |
A3 C1:: A3 C2:: A3:: A3 C3 = 0 / Undefined. Changes in DSe cannot be calculated using this approach |
||||
|
NPv (%) |
100 |
99.80 |
95.83 |
97.33 |
97.89 |
91.58 |
96.48 |
|
NPv change (%) A1 C1:: A1 C2; A2 C1:: A2 C2; A3 C1:: A3 C2:: A3 C3 |
A1 C1:: A1 C2 = 0.2 |
A2 C1:: A2 C2 = 1.50 |
A3 C1:: A3 C2 = 6.31; A3 C2 :: A3 C3 = 4.90; A3 C1 :: A3 ::C3 = 1.41 |
||||
|
Remarks |
Altering conditions within ‘Approach 1’ significantly alters DSe and PPv but not the DSe and NPv |
Altering conditions within ‘Approach 2’does not affect the DSe or PPv but slightly alters (<5%) the DSp and NPv |
Altering conditions within ‘Approach 3’ produces a variation ranging from 1.41 to 6.63% in the NPv but does affect the DSp. |
||||
a, b Refer to Tables 1 and 2; Diagnostic sensitivity - Dse; Diagnostic specificity – Dsp; Positive predictive value – PPv; Negative Predictive value - NPv
P07130-5, USA) was used. Overall 70 serum samples were tested by serology.
Approach 2: Samples were collected from a limited number of animals from two farms located in Gujarat, India at one time point. Under the first condition/ instance, the data of qPCR from two farms was compared to the disease status by culture or serology from samples (n=55); and samples testing positive by culture or serology were considered as positive. All 55 samples were tested by serology. The samples originated from 30 milk and 25 semen samples. Under the second condition / instance, the data was compared to the disease status by culture and AFB staining (n=95) and serology, where of 55/95 samples were tested by serology. The samples originated from 40 feces, 30 milk and 25 semen samples.
Approach 3: Samples were collected at several time points, from same animals, at three months interval (Condition 1- October 2012; Condition 2 – January 2013, Condition 3 – March 2013) over a period of 6 months, from a limited number of animals (n=95) from two farms of Gujarat in India; and the data was compared with results of culture alone. The samples originated from 40 feces, 30 milk and 25 semen samples.
Statistical Analysis
Intra-assay repeatability of the test was analyzed by determining the standard deviation (SD) between the three replicates of each sample done on the same day. Inter-assay reproducibility of triplicate samples between runs on three different days were tested by measuring the standard deviation (SD) using Bland Altman plot (MedCalc® software version 15.2.2). DSe and DSp of qPCR with reference to culture results from clinical isolates were determined using ROC curve analysis (MedCalc® software ver 14.12, 1993-2015) and kappa statistics (Graph Pad software).
RESULTS
A comparative assessment of analytical specificity of ISMav2 and IS900 qPCR on 14 strains of the genus Mycobacterium indicated that ISMav2 assay was specific for M. avium subsp. paratuberculosis strains, since it identified all 8 strains of MAP but not any other strain of pathogenic and non pathogenic Mycobacterium (n=5) included in this study (Table 3). In addition, the ISMav2 qPCR did not amplify DNA extracted from other non-mycobacterial strains (n=10) (Table 3). The Cq values of DNA extracts of cultures positive by ISMav2 assay ranged from 14.68 (Reference MAP K10 ATCC strain) to 38.72 (clinical field isolates from bovines). However, the IS900 qPCR could not discriminate MAP from other Mycobacterium strains, since it strongly amplified DNA extracted from MAP K10 strain (Cq value 9.78) as well as from M. tuberculosis , M. bovis , M. bovis BCG, M. avium, M. smegmatis and M. phlei (Cq value ranged from 27.8 – 29.8) (Table 3). The IS900 qPCR was not evaluated further due its non specific character reported in these experiments.
The ISMav2 qPCR could detect up to 500 fg of the MAP DNA from templates generated from tenfold serial dilutions of MAP DNA ranging from 500ng to 50 fg, run in triplicates (Figure 1 and 2). The lower level of detection (LOD) for the assay in terms of copy number derived similarly from a dilution series of positive plasmid construct/ Internal Amplification Control (IAC) was approximately 7 copies. Initial runs of the ISMav2 qPCR assay up to 60 cycles employing DNA templates derived from sterile PBS (pH 7.4), Middlebrook 7H9 broth and milk samples from bovines negative by liquid culture in the MGIT BACTEC 960 system and by commercial ELISA, indicated that baseline Cq values were within 40 to 45 cycles. While qPCR assays run in triplicate on different days using templates derived from sterile PBS (pH 7.4), Middlebrook 7H9 broth and milk samples negative by culture spiked with 1x 10⁷ Cells/ml of MAP K10 strain produced Cq values < 39. Thus the cut-off Cq value for declaring a sample as positive was determined to be < 40, and the optimum number cycles for the assay was fixed to 40. Standard curves plotted employing tenfold serial dilution of IAC standard displayed a linear order of detection up to ~7 copies. Repeated runs of these standards showed significant correlation-ship between runs (r2 = 0.98) and reaction efficiency of qPCR varied from 87 to 94%. Thereafter, the number of copies present in test samples were estimated employing the standard curve described above.
The repeatability of the qPCR as estimated by calculating the intra-assay variability using the standard deviation (SD) of mean of triplicate Cq values derived from templates of tenfold serial dilutions of MAP K10 strain, rang ing from 500ng to 50fg, indicated that SD lies with an acceptable range of 0.04-0.46 (Figure 1). Similarly, the assay was found to be reproducible since the inter-assay variability of qPCR measured in term of the SD of the mean Cq
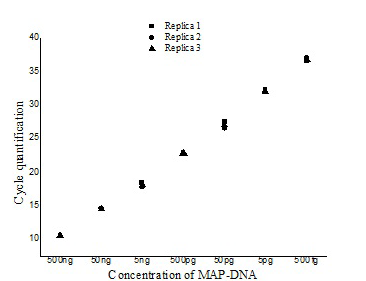
Figure illustrating the variation with in the three replicates of serially diluted MAP-DNA from 500ng to 50 fg analysed in the same run (■- Replica1, ●– Replica 2, ▲- Replica 3).
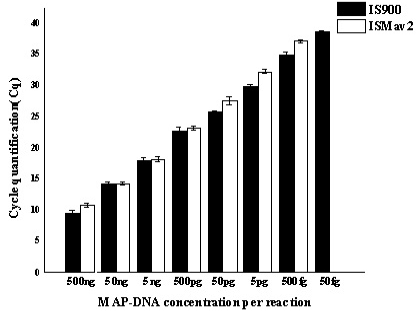
Serially diluted MAP-DNA analysed in triplicates on three different days, by using both IS900 and ISMav2 gene targets. Mean of the three different days were plotted with Standard deviation.
values of 9 runs (triplicates run on three different days) lies between 0.28 to 0.66 (Figure 2) and was within the limits of Mean + 1.96 SD as determined by Bland Altman Plot analysis (data not shown). The effect of chemical and biological matrices on results ISMav2 qPCR studied through spiking experiments using tenfold serial dilutions of MAP cultures in sterile PBS (pH 7.4), Middlebrook 7H9 broth, and known negative milk, feces and semen samples of bovine origin showed that LODs in case of PBS (pH 7.4), Middlebrook 7H9 broth and milk was 1x10⁴ cells/ml, and for feces and semen 1x10⁵ cells/ml and 1x10³ cells/ml, respectively (Figure 3).
The linear order of detection was maintained from 1x10⁷ up to 1x10⁴ cells/ ml for PBS (pH 7.4), Middlebrook 7H9
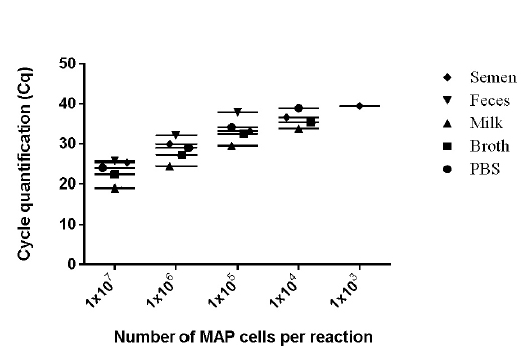
Figure 3: Detection limits of MAP K-10 (ATCC
Strain were diluted in various clinical and chemical matrices. 1X10⁷ to 1X101 MAP cells/ml were spiked in different matrices (Semen, Milk, Phosphate buffered saline, and Middlebrook 7H9 Broth). Whereas 1X10⁷ to 1X101 MAP cells were spiked per gram of feces. Mean of the three days were plotted in graph. The number of M. avium subsp paratuberculosis (MAP) organisms per/reaction is shown on X-axis and CT values are on the Y-axis (●- PBS, ■ - Broth, ♦- Semen, ▲- Milk, ▼- Feces).
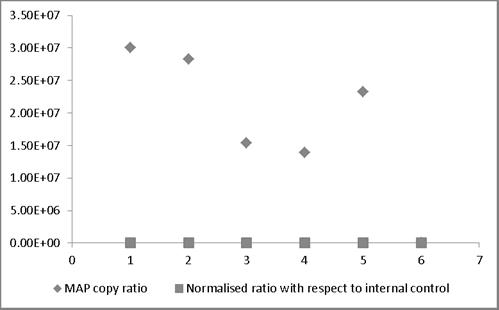
MAP copy ratio = copy number of sample before normalization/copy number of sample with lowest copy normalization; Normalized ratio = copy number of sample after normalization/copy number of sample with lowest copy after normalization. Most of the normalized Ct values expressed as ratio lie around 1 providing a truer representation compared to those values not normalized and therefore representing larger variation.
broth and milk. Similarly, in case bovine feces and semen, the linear order of detection ranged from 1x10⁷ to 1x10⁵ and 1x10⁷ to 1x10³, respectively. DNA was extracted from all the samples and real-time PCR reactions were performed. The genome quantification experiments indicated that normalization with equal amounts of extraneous HPV-18L1 DNA was essential, since variation in Cq values of ISMav2 qPCR prior to normalization were 104 to 105 folds higher. The copy numbers of the genes were calculated using two independent standard curves. Normalization of Cq values resulted in reduction (decreased by an order of magnitude 104 to 105 folds) in the variation in copy number, since the degree of variation were minimal (< 0) (Figure 4).
When the diagnostic estimates of the ISMav2 assay was based on the approach (Approach 1) of using large sample size (n=1008) under the condition (Condition 1) where a clinical samples was drawn at single time point, and was considered infected with MAP if it was identified as positive by culture and AFB staining; the approach and the condition returned a diagnostic sensitivity (DSe), diagnostic specificity (DSp), positive predictive Value (PPv) and negative predictive value (NPv) of 100% (95% CI |63.06 -100.0|), 99.9% (95% CI |99.44 100.0|), 88.89% (CI |51.75 -99.72|), and 100% (95%CI |99.75 -100.0|), respectively. Also, the qPCR and the test condition were strongly associated (κ = 0.941 (95% CI |0.825 – 1.00|) (Table 4). However, the return of diagnostic estimates were affected, if under the same approach (Approach 1) the conditions (Condition 2) for identification of infected sample were based on combined status of culture, AFB staining and serology; under the changed conditions the Dse, Dsp, PPv and NPv were 81.82% (95% CI |48.22 -97.72.0|), 99.40% (95% CI |98.6999.78|), 60.0% (95% CI |32.29 -83.66|), and 99.80% (95% CI |99.27 -99.98|), respectively (Table 4). The selected conditions and the qPCR however, were still statistically well associated (κ = 0.688, 95% CI |0.484 – 0.893|) (Table 4).
The effect of relatively smaller sample size on the outcome of diagnostic estimates was determined using two approaches. The approach (Approach 2) of selecting a small sample size (n=55) and the condition (Condition 1) for identification of MAP infection based culture on serology status returned diagnostic estimate characterized by a DSe 33.33% (95% CI |0.84 -90.57|), DSp 88.46% (95% CI |75.66 -95.65|), PPv 14.29% (95% CI |0.36- 57.87|), and NPv 95.83% (95% CI |85.27 -99.49|) (Table 4). An alteration in condition (Condition 2) in the above approach (Approach 2), wherein the criteria for identification of MAP infection in samples (n=95) was determined by culture, AFB staining and serology status, subtly affected the diagnostic estimates of ISMav2 qPCR (DSe 33.33% (95% CI |0.84 -90.57|), DSp 93.48% (95% CI |86.34 -97.57|), PPv 14.29% (95% CI |0.36- 57.87|), and NPv 97.33% (95% CI |92.03 -99.72|) (Table 4). Both the above selected conditions (Conditions 1 and 2) were poorly associated with the qPCR assay (Condition 1: κ = 0.134; Condition 2: κ = 0.163) (Table 4).
The impact on determination of diagnostic estimates of the qPCR due to sampling approaches that compared the effect of multiple point sampling (October 2012, January 2013 and March, 2013) using a small sample size (n=95) derived from two herds, wherein the MAP infection status was based on culture alone (Approach 3) are furnished in Table 5. Each time point of sampling versus status by culture was defined as a condition (Condition 1: Sampling time point - October 2012; Condition 2: Sampling time point - January, 2013; Condition 3: Sampling time point - March, 2013). The approach was unable to define or return the DSe or PPv characteristics. However, the DSp of the qPCR was unaffected (100% (95% CI |97.07 -100|) under all three conditions; but the NPv fluctuated from a minimum of 91.58% to a maximum of 97.81%. All the three selected conditions and the qPCR were poorly associated under each circumstances (κ = 0.0) (Table 5). The overall impact on diagnostic estimates of qPCR due to variations in sample size, sampling pattern and criteria adopted for diagnosis of the disease status are summarized in Table 6.
DISCUSSION
Although the selected primers and TaqMan probes based on IS900 and ISMav2 gene targets were completely homologous to the MAP sequence by BLAST analysis, they were also homologous to the sequence from other Mycobacterium strains, Rhodococcus and Corynebacterium species in silico. However, comparative assessment of IS900 and ISMav2 qPCR assays on a panel of 9 MAP strains, 5 Mycobacterium strains other than MAP and 10 non Mycobacterium strains indicated that the ISMav2 assay was specific, but not the IS900. A comparative assessment of the primers and probes previously used for validation of IS900 (Khare et al., 2004; Plain et al., 2014) and ISMav2 (Schonebrucher et al., 2008) qPCR assays by BLAST analysis in the current study had indicated (data not shown) that either one or more of the selected sequence(s) in each of these studies in addition to being homologous to MAP shared complete or partial homology with other Mycobacterium strains as well as other non-Mycocobacterium strains (Rhodococcus, Corynebacterium and few other species). Despite the in silico predictions, both the IS900 and ISMav2 qPCR assays were shown to be specific on large DNA panels comprising of MAP and non-MAP strains and templates derived from clinical samples (Khare et al., 2004; Plain et al., 2014; Schonebrucher et al., 2008).
Employing a gene target (ISMav2) with low copy number for qPCR up to 0.5 pg (500 fg) of MAP DNA was detectable in this study. Similarly, the limit of detection of MAP cells derived from optimization experiments involving bovine semen, milk and feces samples were 1x10³, 1x10⁴ and 1x10⁵ Cells per assay, respectively. Previous reports on real time qPCR for MAP identification had indicated similar or better analytical sensitivity. Employing low copy number gene targets (F57 and ISMav2) up to 0.1 pg of MAP DNA and 1x10² CFU of MAP/gram of bovine feces (Schonebrucher et al., 2008) and 1x10² CFU of MAP/ml of milk (Stratmann et al., 2002) had been detected. Reports on validation of qPCR assays using MAP sequence targets with high copy number (IS900) indicated that qPCR assays detected less than <10 MAP cells/ 2 ml of milk and per 200 mg of feces (Khare et al., 2004). In the current study we used a commercial DNA extraction protocol (Tetracore®) that included a step that involved mechanical disruption of MAP cells by bead beating, but without the step of immuno-magnetic beads for capture and enrichment of the template as described in other MAP qPCR validation reports (Stratmann et al., 2002; Khare et al., 2004; Stratmann et al., 2005; Plain et al., 2014). Enhancement of analytical and diagnostic sensitivity of qPCRs for MAP has been shown previously by employing the adopting the immuno-magnetic bead capture step (Stratmann et al., 2002; Khare et al., 2004; Stratmann et al., 2005; Plain et al., 2014). The viability and mass of MAP culture (exponential phase measured by ‘Growth Index in liquid BACTEC cultures), preparation of templates from the starting material, such as ratio of suspension of feces in saline, stoichiometric inconsistencies resulting from sub-sampling from original sample, may influence the level of detection, as reported previously (Plain et al., 2014). Taken together, all the factors mentioned above could have affected the detection limits of the current study.
The ISMav2 qPCR was found reliable, since the statistical estimates of repeatability and reproducibility of a series of runs of the assay, performed on a ‘single operator’ basis that included an internal amplification control, were valid at 95% confidence intervals. Although the efficiency of qPCR varied from 87% to 94% compared to 97.87% (Schonebrucher et al., 2008) inclusion of an internal amplification control in the ISMav2 qPCR ensured that false positive amplification did not occur and assured the diagnostic quality (Stratmann et al., 2002; Schonebrucher et al., 2008). In addition, inclusion of the heterologous exogenous control plasmid DNA sequence derived from HPV-18L1 gene in the validation process, for normalization of Cq values of ISMav2 qPCR; minimized the biological variation induced by different matrix, thus adding further significance to the quality of qPCR results.
To test the validation of the ISMav2 qPCR under clinical settings, we used three approaches; and each approach was tested under a set of conditions related to the sample size, sampling time points, a single or a combination of ante-mortem tests for identification of the disease status for determination of the validation estimates. We adopted these strategies because the earlier reports had described that the factors cited above could affect the results of an assay (Stratmann et al., 2005; Plain et al., 20144) and because a) no single ante-mortem test has been found particularly suitable for determination of true prevalence of Johne’s disease (Plain et al., 2014), and b) variable shedding pattern due to the pathogenic characteristics of MAP under different endemic situations (Taylor et al., 1981; Stratmann et al., 2005; Plain et al., 2014). Our studies indicated that different approaches adopted in this study can influence the validation estimates ranging from subtle to drastic. Since as indicated in the results: a) Altering conditions within ‘Approach 1’ significantly altered the DSe and PPv but not the DSe and NPv of the assay; b) Altering conditions within ‘Approach 2’ did not affect the DSe or PPv but slightly altered (<5%) the DSp and NPv; and c) Altering conditions within ‘Approach 3’ produced a variation ranging from 1.41 to 6.63% in the NPv but did not affect the DSp. The multiple approach to test the strategy for validation of the qPCR indicated that the best return of validation estimates of the ISMav2 qPCR assay were obtained, when large sample size (n=1008) drawn from single time point sampling, covering diverse geographical areas, were tested for disease status based on the combined results of liquid culture in BACTEC 960 system and AFB staining and compared with the qPCR assay. In contrasts smaller sample size (n=55/ n=95) covering two herds from Gujarat and sampled at multiple time points between October 2012 to March 2013 when tested for MAP by culture alone, failed to return the full range of validation estimates; since it could only determine DSp and NPv but not define and determine the Dse and PPv of the assay.
We had adopted the guidelines of validation protocol as mentioned in the OIE manual (OIE, 2014) and according to Bustin et al., 2009 in the current study, but we did not adopt the additional guidelines as mentioned by Schonebrucher et al. (2008) and Plain et al. (2014). Our qPCR results for determination of accuracy of the diagnostic test were based on and comparable to liquid culture in MGIT BACTEC 960, as had been recommended earlier (Plain et al., 2014). The average limit of detection MAP cells in bovine biological matrix was 1x10⁴ MAP cells despite the fact that assay was capable of consistently detecting 500 fg of MAP DNA and at least 7 copies of the IAC. Review of literature had indicated that 1x10² or < 10 MAP cells can be detected either by using low (ISMav2) or high (IS900) copy number gene targets when template enrichment had been performed employing immune-magnetic bead capture with incorporation of a MAP specific aMptD peptide (Stratmann et al., 2005) or without using the peptide ligand (Khare et al., 2004; Plain et al., 2014). One of the reasons for detection limits in our assay therefore may be the above facts.
Despite these limitations, we were able to determine the diagnostic estimates of real time qPCR for MAP on 1008 clinical samples in India and the qPCR and the test conditions were strongly associated. Thus it appears that the assay possesses the potential of a reliable and rapid diagnostic test for field application.
ACKNOWLEDGEMENT
The authors are grateful to the management of the National Diary Development Board (NDDB), Anand for providing the facilities to carry out this work.
The author Rama Lakshmi Bonda expresses her gratitude to the Indian Immunologicals Limited, Hyderabad for providing the opportunities to work on the above topic with respect to partial fulfilment for her PhD thesis.
AUTHOR’S CONTRIBUTION
BRL carried out the optimization and validation work, prepared the data and wrote the initial draft of the paper. FM conceptualized and designed the study, conducted statistical analysis, and wrote the paper. KSNLS performed the statistical analysis and prepared the graphs. KM was involved in the isolation of MAP from farm samples. VSB, AP and SKR collected samples from farms and the fields. NMP provided the clone containing the positive plasmid construct of HPV-18L1 and primer and TaqMan probes for qPCR. GKS provided the administrative and financial support from the NDDB. All the authors are thankful to VAS for critically reviewing and editing the manuscript.
CONFLICT OF INTEREST
The authors declare no conflict of interest related to this article.
REFERENCES


