Advances in Animal and Veterinary Sciences
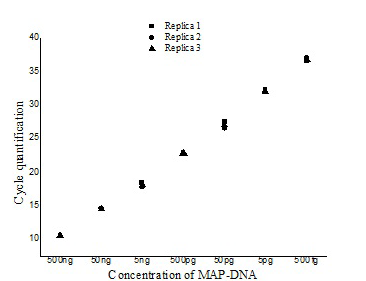
Figure 1: Intra-assay variability
Figure illustrating the variation with in the three replicates of serially diluted MAP-DNA from 500ng to 50 fg analysed in the same run (■- Replica1, ●– Replica 2, ▲- Replica 3).
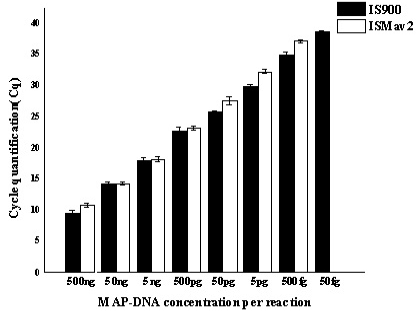
Figure 2: Reproducibility study of Inter-assay variability Serially diluted MAP-DNA analysed in triplicates on three different days, by using both IS900 and ISMav2 gene targets. Mean of the three different days were plotted with Standard deviation.
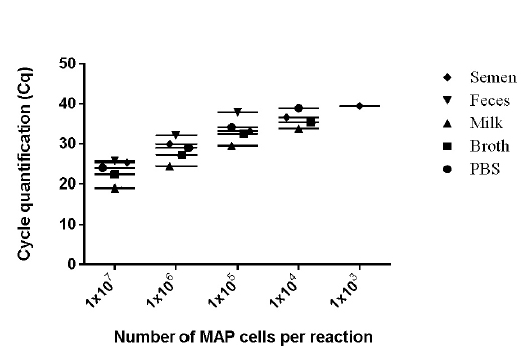
Figure 3: Detection limits of MAP K-10 (ATCC)
Strain were diluted in various clinical and chemical matrices. 1X10⁷ to 1X101 MAP cells/ml were spiked in different matrices (Semen, Milk, Phosphate buffered saline, and Middlebrook 7H9 Broth). Whereas 1X10⁷ to 1X101 MAP cells were spiked per gram of feces. Mean of the three days were plotted in graph. The number of M. avium subsp paratuberculosis (MAP) organisms per/reaction is shown on X-axis and CT values are on the Y-axis (●- PBS, ■ - Broth, ♦- Semen, ▲- Milk, ▼- Feces).
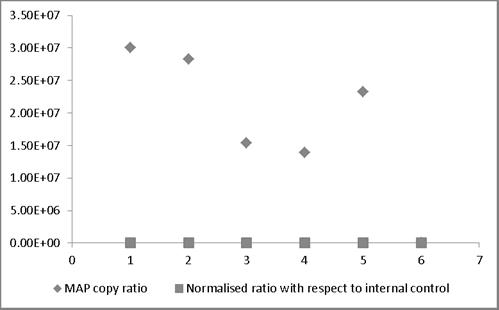
Figure 4: Normalization of quantified MAP copy number by exogenous internal control
MAP copy ratio = copy number of sample before normalization/ copy number of sample with lowest copy normalization; Normalized ratio = copy number of sample after normalization/ copy number of sample with lowest copy after normalization. Most of the normalized Ct values expressed as ratio lie around 1 providing a truer representation compared to those values not normalized and therefore representing larger variation.


