Advances in Animal and Veterinary Sciences
Research Article

Haematobiochemical Profile in Chronic Acetamiprid Exposure in Sprague Dawley Rats
Samiran Mondal1*, Sunit Kumar Mukhopadhayay1, Sanjit Kumar1, Partha Sarathi Mandal1, Saktipada Pradhan1, Sreerupa Biswas2, Kamal Purohit3
1Department of Veterinary Pathology, WBUAFS, Kolkata 37; 2Associate Operations Specialist at Quintiles; 3Department of Veterinary Pathology, RAJUVAS, India.
Abstract | A chronic study was conducted on Sprague Dawley (SD) rats for 13 weeks using 48 rats in four groups each having 12 animals. Group I was control. Group II, III and IV were treatment groups receiving acetamiprid in distilled water in the amount of 5mg/kg, 20mg/kg and 40mg/kg, respectively. Body weight gain and feed consumption was decreased. There was lymphocytopenea in acetamiprid treated animal. Liver and kidney marker enzymes and analyte were altered compared to control after 13 weeks of acetamiprid exposure. This study concluded that acetamiprid, used even in this dose range could cause a significant effect on hematobiochemical profile.
Keywords | Acetamiprid, Chronic study, Lymphocytopanea, SD rat
Editor | Kuldeep Dhama, Indian Veterinary Research Institute, Uttar Pradesh, India.
Received | May 23, 2015; Revised | June 02, 2015; Accepted | June 03, 2015; Published | June 12, 2015
*Correspondence | Samiran Mondal, Department of Veterinary Pathology, WBUAFS, Kolkata, India; Email: vetsamiran@gmail.com
Citation | Mondal S, Mukhopadhayay SK, Kumar S, Mandal PS, Pradhan S, Biswas S, Purohit K (2015). Haematobiochemical profile in chronic acetamiprid exposure in Sprague Dawley rats. Adv. Anim. Vet. Sci. 3(7): 384-394.
DOI | http://dx.doi.org/10.14737/journal.aavs/2015/3.7.384.394
ISSN (Online) | 2307-8316; ISSN (Print) | 2309-3331
Copyright © 2015 Mondal et al. This is an open access article distributed under the Creative Commons Attribution License, which permits unrestricted use, distribution, and reproduction in any medium, provided the original work is properly cited.
INTRODUCTION
Since insecticides are often required to decrease insect pest population and associated crop damage and losses, knowledge of the non-target effects of each choice is essential for selection of the most appropriate insecticide for the situation (Wolfenbarger et al., 2008). Higher uses of acetamiprid to manage the insects by the farmers are causing residue related toxicity to consumer through food chain. Information regarding selectivity of insecticide for judicial use might be generated only through properly designed laboratory and field studies (Mondal et al., 2010).
The persistence and extreme stability of pesticides in the environment are the ultimate source of contamination at the dietary level. As insecticides are used as crop protectants, they are likely to cause indirect exposure in human, domestic as well as wild animal and poultry through feed contaminants, soil and ground water as through ecotoxicant. Even sublethal dose of acetamiprid caused alteration in the electrolyte and micro-mineral balance in mammals (Mondal et al., 2012). Indiscriminate introduction of acetamiprid into food chain through agroindustry may affect the haematobiochemical system of animal and human causing high susceptibility to various diseases and secondary infection. In the present study focus has been made to see the changes in haematobiochemical parameters after multiple exposure to acetamiprid for 13 weeks.
MATERIALS AND METHODS
Study Design
For chronic toxicity study, 48 Sprague Dawley rats were used. Before starting of this experiment, the protocol was approved by IAEC, WBUAFS. For experiment purpose total 48 animals were used in four dose group having 12 animals each. Group I was control group received only distilled water. Goup II, group III and group IV was treated with acetamiprid at dose rate of 5, 20 and 40 mg/kg body weight respectively.
Husbandry
Animals were allowed to acclimatize for a period of 7 days prior to experiment and provided standard feed (Nutri Lab, rodent feed, Vetcare Pvt. Ltd, Bangalore) and allowed water, both ad libitum (RO & UV treated). Three animals per cage were accommodated in polycarbonate cages during the experimental period. Husk was used as bedding material. Husk was strained and sterilized by autoclaving in transparent polythene bag using sterol strip as an indicator of successful sterilization. Changing frequency of bedding material was twice a week.
Chemicals and Formulation
Acetamiprid (CAS No-135410-20-7) was procured from Sigma Aldrich, USA. Acetamiprid was formulated using distilled water as a vehicle. Acetamiprid solution was administered directly in stomach by oral gavages at dose of 5 mg/kg body weight to group II, 20 mg/kg body weight to group III and 40 mg/kg body weight to rats of group IV respectively with dose volume of 10 ml/kg for 13 weeks daily. The control group (Group I) received distilled water. Body weight of rats was recorded weekly for proper administration of acetamiprid solution.
Clinical Observations
Animals were observed twice daily by cage side observation. For clinical observation a time frame of 6:30 to 7:30 both AM and PM was kept. Detailed observations were noted weekly.
Body Weights
Body weights of all animals were taken before start of experiment and then after weekly during the whole study period on electronic balance (model no-T30, E.G. Kantawalla Pvt. Ltd, Pune, India).
Feed Consumption
Food consumption was monitored continuously throughout study. For this, measured amount of feed was provided to the animal and left over feed was measured on next morning before giving any feed to animal. Feed consumption of each group was calculated based on consumption per cage.
Haematology
Collection of blood was done on 1st, 2nd, 5th, 9th and 13th week under light isoflurane anaesthesia into heparinised ependorf by retro-orbital puncture method. Animals were given sufficient time to get under anaesthesia to avoid hypoxic condition or handling related stress. Following blood parameters were analysed manually. Haematological studies were carried out on the day of collection of blood. Haemoglobin (Hb) content of blood was estimated by Sahli’s hemoglobinometer (Coles, 1986). Haematocrit value (HCt) was estimated by microhematocrit method (Coles, 1986). Total erythrocyte count (TEC), Platelets (PLT) and Total leukocyte count (TLC) were estimated as per the method described by Jain (1986) by using Gower’s solution (s d fine- chem. limited, Mumbai - 400030), platelet diluting fluid (Nice chemicals, Kolkata) and W.B.C. diluting fluid (Merck Limited, Mumbai-400018) respectively. Differential leukocyte count was determined as per the method described by Jain (1986) with slight modification.
Blood Chemistry
Following blood collection it was spun at 1640g at 4°C for 5 minutes. Plasma was collected and stored at -20°C for biochemical analysis. Aspertate amino transferase, Alanine aminotransferase, Alkaline phosphatase, glucose, total protein, albumin, globulin, albumin/globulin ratio, total bilirubin, urea, creatinine, phosphorus, calcium, sodium, potasium and chlorine levels in plasma were estimated as per manufactue’s instruction.
Statistical Analysis
Data were analysed using graphpad prism software version 4. Two way ANOVA followed by dunnett’s multiple comparison test were employed to see the difference if any.
RESULTS
Clinical Observation
There were no severe toxic signs in any of groups compare to rats of control group. Chromodacryorrhoea was observed in group IV rat. Treated animals were reluctant to move as compare to control rats. Group IV rats were depressed, showed signs of mouth smacking and mild salivation.
Body Weight
In the present study a dose dependent significant (P≤0.05) decreases in body weights were found in all the treatment groups on 8 week onwards. Group IV (40 mg/kg group) showed significant reduction in body weight gain on 8th week onwards; in group III significant reduction in body weight was observed on 10 week onwards as compared to rats of control group. However in the whole experiment, group II did not show any alteration in body weight gain significantly as compared to control animal (Figure 1).
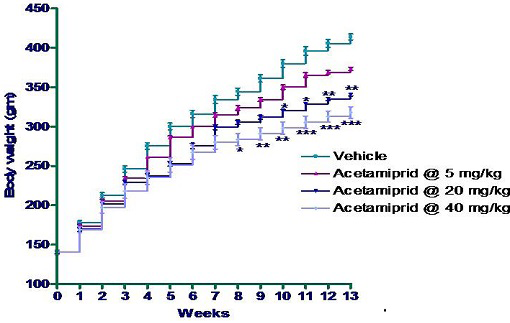
*p≤0.05; **p≤0.01; ***p≤0.001
Feed Consumption
Feed consumption was measured on daily basis per cage. Data were depicted in form of cumulative consumption in a week per animal in Figure 2. There was significant difference in feed consumption of acetamiprid treated animal (mid dose and high dose group) of this experiment. In 2nd week per animal consumption in group IV was significantly (p≤0.01) reduced compared to control animal although other groups under this experiment did not show any significant difference as compared to rats of control group. The same trend was noticed in 3rd week. In 4th week, rats of group III and group IV consumed significantly (p≤0.01) less amount of feed as compared with the rats of control group. And the same trends were observed in 5th week of acetamiprid exposure. In the 6th week of experiment, there was dose dependent significant (p≤0.05) decreased in feed consumption compared with control animal. In 7th & 8th week, only group IV animal which received 40 mg/kg body weight showed significant reduction (p≤0.05) in feed consumption.
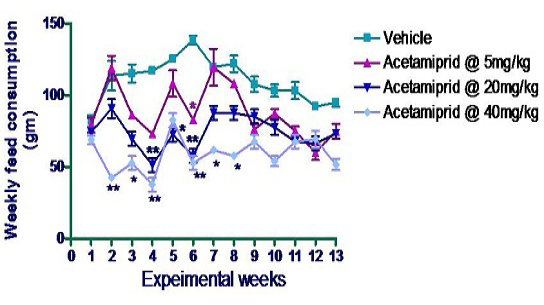
*p≤0.05; **p≤0.01
Haematology
The effect of chronic acetamiprid toxicity on mean values of total erythrocyte counts (X106/µl), hemoglobin (gm/dl), haematocrit value (%), mean corpuscular volume (fl), mean corpuscular hemoglobin (pg), mean corpuscular hemoglobin concentration (gm/dl), Platelets (X103/µl), and total leukocyte count (X103/µl) along with relative counts of neutrophil, lymphocyte, eosinophil, monocyte and basophil for each experimental groups in different week are given in Table 1. The administration of acetamiprid orally for 13 week did not cause any significant (P≤0.05) alteration in the levels of TEC, TLC, Hgb, HCT, PLT, MCV, MCH and MCHC. Significant (P≤0.001) increase in the mean values of percent neutrophil was found in the rats of group IV in 5th, 9th and 13th week as compared to control group. The augmented level of percent neutrophil count was also observed in group II at 13th week (P≤0.01). However there was significant decrease (P≤0.01) in percent lymphocyte count in the rats of group IV in 5th, 9th and 13th weeks of acetamiprid exposure as compared to rats to control group. There was also reduction in percent lymphocyte count in group III at 13th weeks of exposure as compared to group I. However there was no significant differences on percent eosiniphil, monocyte and basophil in acetamiprid administered rats as compared to control group.
Blood Chemistry
Aspartate Amino Transferase
There was no significant alteration in any group in AST level up to 2nd week of acetamiprid exposure. In the 5th week there was significant increase in AST level in 20mg/kg and 40 mg/kg group as compare to control group. After 9th week of exposure of acetamiprid to rat caused significant augmentation in the level AST in a dose dependent manner. Similarly after 13th week of exposure to acetamiprid in rat caused significant increase in plasma level of AST compared to control rat in dose dependent manner (Table 2).
Alanine Amino Transferase
Effect of daily oral administration of acetamiprid on plasma alanine amino transferase of rats of experimental groups were presented in Table 3. There was dose dependent significant (P≤0.05) increase in plasma level of ALT activity in the acetamiprid treated rats compared to rats of control group from 5th week of exposure and this trend existed upto 13th week of exposure of acetamiprid.
Alkaline Phosphatase
Augmented level of ALP activity was observed (P≤0.05) at 5th week of acetamiprid exposure as compare to group I. There was dose dependent significant (P≤0.05) increase in plasma level of ALP activity acetamiprid treated rats compared to rats of control group (Table 4).
Glucose
The effect of the acetamiprid on plasma glucose level in Sprague Dawley rats during chronic toxicity study is given in Table 5. There was significant (P≤0.05) decrease in the plasma glucose level of rats of group IV (acetamiprid 40 mg/kg) compared to rats of the control group at 5th week of exposure whereas at the same time no significant difference in plasma concentration of glucose was found among the rats of group I, II and III. At 9th week, though there were no significant differences in the rats of group II & III compared to rats of control group, but a significant reduction was found in rats of group IV in comparison to vehicle group. There were also a significant reduction of plasma glucose in rats of group III and group IV compared to vehicle one.
Table 1: Effect of Acetamiprid on Hematology after 13 weeks of exposure in SD Rats
|
|
± |
|
Differential count % |
** |
*** |
|
|
|
|
|
||||
|
Wk |
Gro up |
WBC (103/µl) |
Neutr ophil |
Lymph ocyte |
Mono cyte |
Eosi nophil |
Baso phil |
RBC (106/µl) |
HGB (gm/dl) |
HCT (%) |
PLT ( 103/ µl) |
MCV (fL) |
MCH (pg) |
MCHC (gm/dl) |
|
1 |
Veh icle |
6.22± 0.42 |
10.5± 1.25 |
86.5± 1.23 |
2.67± 0.43 |
0.59± 0.28 |
0±0 |
6.71± 0.52 |
14.57 ±1.27 |
35.22 ±2.69 |
524± 71.96 |
52.5± 0.39 |
21.7 ±0.4 |
41.26 ±0.75 |
|
Gr II |
6.64± 0.72 |
11.5± 0.72 |
85.5± 0.64 |
2.17± 0.39 |
1± 0.23 |
0.09± 0.09 |
6.88± 0.52 |
14.99 ±1.38 |
36.29 ±2.67 |
497.84 ±65.38 |
52.9± 0.69 |
21.7 ±0.5 |
41.1± 1.07 |
|
|
G III |
6.25± 0.86 |
10.7± 0.61 |
86.17 ±1.01 |
1.75± 0.29 |
1± 0.35 |
0.42± 0.28 |
7.01± 0.5 |
15.04 ±1.22 |
36.85 ±2.21 |
450.17 ±99.74 |
52.8± 0.59 |
21.4 ±0.3 |
40.59 ±0.89 |
|
|
Gr IV |
5.67± 0.42 |
12.67± 1.11 |
83.5 ±1.6 |
2.75± 0.43 |
0.92± 0.33 |
0.17 ±0.11 |
6.78 ±0.3 |
13.9 ±0.77 |
34.74 ±1.29 |
580.84 ±37.77 |
51.3± 0.53 |
20.5 ±0.3 |
39.91 ±0.65 |
|
|
2 |
Veh icle |
6.89± 0.39 |
12.42 ±0.6 |
85.92 ±0.68 |
1.34± 0.25 |
0.25± 0.12 |
0.09 ±0.09 |
6.57 ±0.47 |
14.49 ±1.14 |
34.84 ±2.23 |
470.17 ±58.68 |
53.2± 0.62 |
22± 0.3 |
41.48 ±1 |
|
Gr II |
5.4± 0.32 |
12.84 ±0.72 |
84.17 ±0.84 |
2.09± 0.16 |
0.92± 0.28 |
0±0 |
7.33± 0.46 |
15.49 ±1.15 |
37.79 ±2.12 |
531.5± 56.87 |
51.7± 0.65 |
21.1 ±0.4 |
40.79 ±0.77 |
|
|
G III |
5.74± 0.41 |
11.17 ±0.63 |
85.67 ±1.43 |
1.84± 0.65 |
0.84± 0.41 |
0.34± 0.17 |
6.74± 0.34 |
13.32 ±0.32 |
37.45 ±2.1 |
539± 29.62 |
56.3 ±4.6 |
20± 1.1 |
36.16 ±2.25 |
|
|
Gr IV |
6.89± 0.15 |
13.59 ±1.37 |
82.42 ±1.73 |
2.67± 0.17 |
0.84± 0.31 |
0.5± 0.13 |
6.74 ±0.3 |
14.07 ±0.89 |
34.95 ±1.61 |
526.84 ±54.4 |
51.9± 0.68 |
20.8 ±0.4 |
40.12 ±0.64 |
|
|
5 |
Veh icle |
6± 1.07 |
10.92 ±0.74 |
86± 0.62 |
2.25± 0.58 |
0.75± 0.22 |
0.09± 0.09 |
6.81 ±0.2 |
14.47 ±0.6 |
35.82 ±1.03 |
538.84 ±65.66 |
52.6 ±0.66 |
21.2 ±0.6 |
40.35 ±0.86 |
|
Gr II |
6.92± 0.54 |
12.59 ±0.62 |
84.17 ±0.75 |
2.17± 0.34 |
0.84± 0.25 |
0.42± 0.21 |
6.48 ±0.26 |
13.09 ±0.22 |
33.97 ±1.18 |
565.17 ±56.84 |
52.5 ±0.74 |
20.3 ±0.7 |
38.69 ±1.09 |
|
|
G III |
7.84± 0.71 |
13.75 ±1.55 |
83.17 ±1.76 |
1.92± 0.36 |
1± 0.35 |
0.17± 0.11 |
6.85 ±0.38 |
14.5 ±0.9 |
35.82 ±1.92 |
591.5± 65.34 |
52.3 ±0.61 |
21.2 ±0.3 |
40.42 ±0.4 |
|
|
Gr IV |
6.9± 0.54 |
19.5± 1.07*** |
77.17 ±1.1** |
2.17± 0.39 |
1.17 ±0.5 |
0±0 |
7.01 ±0.21 |
14.17 ±0.7 |
35.3 ±1.21 |
590.34 ±42.84 |
50.3 ±0.28 |
20.2 ±0.4 |
40.05 ±0.64 |
|
|
9 |
Vehi cle |
6.75± 0.57 |
11.84 ±0.71 |
86± 0.54 |
1.42± 0.24 |
0.67± 0.28 |
0.09± 0.09 |
6.32 ±0.26 |
13.3± 0.28 |
32.35 ±1.02 |
609.67 ±33.37 |
51.4 ±0.82 |
21.2 ±0.8 |
41.23 ±0.95 |
|
Gr II |
6.37± 0.35 |
12.59 ±0.79 |
84± 1.3 |
2.17± 0.43 |
0.92± 0.28 |
0.34± 0.11 |
6.41 ±0.3 |
13.34 ±0.44 |
33.74 ±1.25 |
578.17 ±48.76 |
52.8 ±0.88 |
20.9 ±0.5 |
39.57 ±0.32 |
|
|
G III |
5.42± 0.32 |
13.67 ±1.52 |
82.67 ±1.39 |
2.67± 0.43 |
0.59± 0.21 |
0.42± 0.21 |
6.79± 0.36 |
14.24 ±1.13 |
35.04 ±2.25 |
581.34 ±30.75 |
51.5 ±0.74 |
20.9 ±0.5 |
40.48 ±0.54 |
|
|
Gr IV |
6.84± 0.64 |
23.59± 0.89*** |
73± 0.49*** |
2.67± 0.55 |
0.67± 0.22 |
0.09± 0.09 |
6.62± 0.16 |
13.79 ±0.31 |
33.97 ±0.85 |
633.84 ±35.13 |
51.4 ±0.14 |
20.9 ±0.6 |
40.61 ±0.52 |
|
|
13 |
Vehi cle |
6.3± 0.63 |
12± 0.79 |
86± 0.5 |
1.59± 0.36 |
0.25± 0.12 |
0.17± 0.11 |
6.45± 0.46 |
13.84 ±1.26 |
34.4± 2.02 |
474.67 ±40.67 |
53.7 ±1.8 |
21.3 ±0.7 |
40.03 ±1.96 |
|
Gr II |
5.84± 0.66 |
16.34 ±0.41 |
80.92 ±0.09 |
1.84± 0.45 |
0.67± 0.22 |
0.25± 0.12 |
6.73± 0.42 |
14.49 ±0.94 |
35.17 ±1.89 |
552.34 ±61.3 |
52.4 ±0.87 |
21.5 ±0.3 |
41.15 ±0.9 |
|
|
G III |
6.19± 0.55 |
18.17± 0.68** |
78.9 ±0.2** |
2.25± 0.43 |
0.75± 0.39 |
0.25± 0.12 |
6.52± 0.12 |
13.52 ±0.27 |
33.79 ±0.54 |
527.67± 56.93 |
51.8 ±0.31 |
20.7 ±0.1 |
40.01 ±0.3 |
|
|
Gr IV |
7.65± 0.61 |
23.5± 1.5*** |
70.75± 0.29*** |
2.34± 0.52 |
1.34± 0.41 |
0.42± 0.16 |
6.97± 0.37 |
14.27 ±0.91 |
35.05 ±1.86 |
540.84± 53.72 |
50.3± 0.64 |
20.5 ±0.6 |
40.64 ±0.62 |
|
Values presented as Mean±SE; **p ≤0.01; ***p≤0.001
Total Protein, Albumin, Globulin and Albumin Globulin Ratio
The effect of chronic exposure of acetamiprid in different doses on plasma total protein, albumin, globulin and albumin globulin ratio of Sprague Dawley rats are presented in Table 6, 7, 8 and 9, respectively.
There were no significant changes in the levels of plasma total protein in rats of acetamiprid treated groups after 13 week of exposure. Significant increase in plasma albumin level was found in rats of group IV compared to rats of control group after 13 week of acetamiprid exposure. Although there was no significant increase in the plasma albumin levels of rats of group II, III compared to rats of control group.
Table 2: Effect of acetamiprid on aspartate amino transferase for 13 weeks
|
Acetamiprid |
||||
|
AST (IU/L) |
Vehicle |
5 mg/kg |
20 mg/kg |
40 mg/kg |
|
1 week |
72±1.16 |
74.17±1.86 |
81.34±0.89 |
79.34±2.25 |
|
2 week |
75.34±1.46 |
74.84±1.73 |
78.67±2.31 |
88.53±4.79 |
|
5 week |
71.67±6.59 |
90.67±3.49 |
106.672.58** |
121.84±1.33*** |
|
9 week |
72.17±4.17 |
99.34±2.85** |
110.5±3.08*** |
130.84±1.43*** |
|
13 week |
72±2.02 |
110.34±3.11** |
121.84±1.43*** |
135.5±2.19*** |
Values presented as Mean±SE; **p≤0.01; ***p≤0.001
Table 3: Effect of acetamiprid on alanine amino transferase for 13 weeks
|
Acetamiprid |
||||
|
ALT (IU/L) |
Vehicle |
5 mg/kg |
20 mg/kg |
40 mg/kg |
|
1 week |
33.17± 1.84 |
38±3.06 |
41.17± 2.41 |
44.84± 1.41 |
|
2 week |
34.17± 1.52 |
41.84± 2.81 |
52.17± 3.55 |
55.17± 2.73 |
|
5 week |
32.5± 1.26 |
50.84± 3.33* |
55.34± 1.34** |
67.5± 2.28*** |
|
9 week |
31.5± 1 |
52.34± 2.85* |
60.34± 1.21*** |
81.17± 1.73*** |
|
13 week |
32.5± 0.89 |
67± 2.74** |
65.17± 2.04*** |
94.34± 2.77*** |
Values presented as Mean±SE; *p≤0.05; **p≤0.01; ***p≤0.001
Table 4: Effect of acetamiprid on alkaline phosphatase for 13 weeks
|
Acetamiprid |
||||
|
ALP (IU/L) |
Vehicle |
5 mg/kg |
20 mg/kg |
40 mg/kg |
|
1 week |
234.67± 6.01 |
237.67± 6.01 |
242.67± 6.01 |
247.67± 6.01 |
|
2 week |
234± 5.28 |
237± 5.28 |
244± 5.28 |
251± 5.28 |
|
5 week |
233.67± 6.33 |
239.67± 6.33 |
249.67± 6.33 |
259.67± 6.33* |
|
9 week |
235.67± 4.25 |
244.67± 4.25* |
256.67± 4.25** |
271.67± 4.25** |
|
13 week |
235.17± 4.05 |
248.17± 4.05** |
263.17± 4.05*** |
278.17± 4.05*** |
Values presented as Mean±SE; *p≤0.05; **p≤0.01; ***p≤0.001
Though there were no significant differences on plasma globulin levels but dose dependent decrease in the levels of plasma globulins was observed in the rats of experimental groups over the whole experimental period.
Table 5: Effect of acetamiprid on plasma glucose for 13 weeks in SD rats
|
Acetamiprid |
||||
|
Glucose mg/dl |
Vehicle |
5 mg/kg |
20 mg/kg |
40 mg/kg |
|
1 week |
75.5± 8.9 |
79.5± 4.14 |
86.67± 3.67 |
81.34± 2.57 |
|
2 week |
81.84± 2.33 |
79±3.42 |
85.17± 3.16 |
80.67± 3.53 |
|
5 week |
85.5± 4.03 |
85.84± 3.27 |
82.5± 2.75 |
74.5± 4.86* |
|
9 week |
84.67± 2.05 |
81.84± 1.86 |
78±3.48 |
73± 4.94* |
|
13 week |
83.17± 4.07 |
78± 3.44 |
69.84± 2.75** |
63± 3.62*** |
Values presented as Mean±SE; *p≤0.05;**p≤0.01; ***p≤0.001
Table 6: Effect of acetamiprid on plasma protein for 13 weeks in SD rat
|
Acetamiprid |
||||
|
Total Protein (g/dl) |
Vehicle |
5 mg/kg |
20 mg/kg |
40 mg/kg |
|
1 week |
6.74±0.22 |
6.79±0.24 |
6.52±0.29 |
6.84±0.12 |
|
2 week |
6.74±0.34 |
6.7±0.18 |
6.9±0.14 |
6.95±0.21 |
|
5 week |
6.9±0.23 |
7.09±0.28 |
6.94±0.2 |
7.17±0.15 |
|
9 week |
7.04±0.12 |
6.65±0.29 |
6.71±0.3 |
6.94±0.09 |
|
13 week |
7.09±0.12 |
6.89±0.23 |
6.65±0.25 |
7.34±0.09 |
Values presented as Mean±SE
Table 7: Effect of acetamiprid on plasma albumin for 13 weeks in SD rat
|
Acetamiprid |
||||
|
Albumin (g/dl) |
Vehicle |
5 mg/kg |
20 mg/kg |
40 mg/kg |
|
1 week |
3.77±0.09 |
3.8±0.18 |
3.74±0.18 |
3.74±0.09 |
|
2 week |
3.7±0.09 |
3.74±0.22 |
3.84±0.18 |
3.84±0.14 |
|
5 week |
3.85±0.25 |
3.72±0.15 |
3.92±0.15 |
4.1±0.26 |
|
9 week |
3.84±0.22 |
3.97±0.11 |
3.9±0.18 |
4.4±0.21 |
|
13 week |
3.75±0.21 |
3.87±0.1 |
3.9±0.17 |
4.65±0.26* |
Values presented as Mean±SE; *p≤0.05
The plasma albumin globulin ratio of rats of group IV was higher than rats of control group and overall an increases (non-significant) in the albumin globulin ratio of rats of group II and III compared to rats of control group.
Total Bilirubin
The results of daily exposure of acetamiprid for 13 weeks in Sprague Dawley rats in plasma bilirubin level is presented Table 10. The level of total bilirubin in plasma was increased significantly in group III and group IV at 9th week of exposure compared to rats of control group. Although after 13 week of daily exposure to acetamiprid, the plasma level of bilirubin was found to be increased significantly in the treated rats compared rats of control group.
Table 8: Effect of acetamiprid on plasma globulin for 13 weeks in SD rat
|
Acetamiprid |
||||
|
Globulin (g/dl) |
Vehicle |
5 mg/kg |
20 mg/kg |
40 mg/kg |
|
1 week |
2.97±0.24 |
2.99±0.3 |
2.79±0.44 |
3.1±0.18 |
|
2 week |
3.04±0.29 |
2.97±0.36 |
3.07±0.25 |
3.12±0.19 |
|
5 week |
3.05±0.31 |
3.37±0.19 |
3.02±0.3 |
3.07±0.18 |
|
9 week |
3.2±0.18 |
2.69±0.34 |
2.8±0.42 |
2.54±0.23 |
|
13 week |
3.34±0.26 |
3.02±0.27 |
2.75±0.3 |
2.69±0.3 |
Values presented as Mean±SE
Table 9: Effect of acetamiprid on albumin: globulin ratio for 13 weeks in SD rat
|
Acetamiprid |
||||
|
Albumin/ Globulin |
Vehicle |
5 mg/kg |
20 mg/kg |
40 mg/kg |
|
1 week |
1.32±0.12 |
1.35±0.16 |
1.62±0.38 |
1.23±0.09 |
|
2 week |
1.27±0.11 |
1.48±0.37 |
1.31±0.13 |
1.26±0.09 |
|
5 week |
1.4±0.27 |
1.12±0.07 |
1.39±0.19 |
1.38±0.15 |
|
9 week |
1.24±0.13 |
1.6±0.18 |
1.59±0.29 |
1.86±0.28 |
|
13 week |
1.18±0.14 |
1.35±0.16 |
1.52±0.2 |
1.93±0.37 |
Values presented as Mean±SE
Table 10: Effect of acetamiprid on total bilirubin for 13 weeks in SD rat
|
Acetamiprid |
||||
|
Total Bilirubin (mg/dl) |
Vehicle |
5 mg/kg |
20 mg/kg |
40 mg/kg |
|
1 week |
0.53±0.13 |
0.5±0.14 |
0.6±0.06 |
0.55±0.11 |
|
2 week |
0.47±0.09 |
0.65±0.06 |
0.79±0.06 |
0.84±0.17 |
|
5 week |
0.64±0.06 |
0.8±0.07 |
1.14±0.13 |
1.09±0.16 |
|
9 week |
0.55±0.09 |
1.09±0.09 |
1.27±0.1* |
1.5±0.13** |
|
13 week |
0.72±0.11 |
0.84±0.11 |
1.72±0.11** |
2.6±0.4*** |
Values presented as Mean±SE; *p≤0.05; **p≤0.01; ***p≤0.001
Table 11: Effect of acetamiprid on creatinine for 13 weeks in SD rat
|
Acetamiprid |
||||
|
Creatine(mg/dl) |
Vehicle |
5 mg/kg |
20 mg/kg |
40 mg/kg |
|
1 week |
0.47±0.05 |
0.52±0.04 |
0.5±0.03 |
0.69±0.05 |
|
2 week |
0.5±0.09 |
0.54±0.05 |
0.57±0.05 |
0.79±0.04 |
|
5 week |
0.45±0.06 |
0.59±0.07 |
0.85±0.04** |
1.0±0.05** |
|
9 week |
0.52±0.07 |
0.64±0.07 |
0.88±0.05** |
1.1±0.03** |
|
13 week |
0.53±0.05 |
0.69±0.11 |
0.98±0.03** |
1.6±0.04*** |
Values presented as Mean±SE; **p≤0.01; ***p≤0.001
Creatinine
The effect of the acetamiprid exposure after daily oral administration for 13 weeks to Sprague Dawley rats on plasma creatinine is shown in Table 11. There was increase in creatinine levels in a dose dependent manner in acetamiprid treated rats except in rats of group II as compared to rats of control group (group I) from 5th week onward. The same trend was found upto 13 weeks of exposure to acetamiprid where creatinine was increased significantly to 1.56 mg/dl in group IV (acetamiprid 40 mg/kg).
Blood Urea Nitrogen
The effect of acetamiprid on blood urea nitrogen in SD rats is presented in Table 12. There was significant (**p≤0.01) increase in blood urea nitrogen level in rats of group IV only at 9th week of exposure compared to rats of control group. Augmented level of BUN was found in rats of group III and IV at the end of 13 week exposure.
Table 12: Effect of acetamiprid on blood urea nitrogen for 13 weeks in SD rat
|
Acetamiprid |
||||
|
BUN (mg/dl) |
Vehicle |
5 mg/kg |
20 mg/kg |
40 mg/kg |
|
1 week |
22.17±0.95 |
23.34±1.03 |
22.8±1.67 |
21.17±1.56 |
|
2 week |
22±1.19 |
23.67±1.57 |
21.1±1.05 |
24±0.94 |
|
5 week |
21.5±1.44 |
20.5±1.09 |
21.5±1.39 |
26.5±1.26 |
|
9 week |
22.67±0.92 |
21.84±1.2 |
22.17±0.9 |
33±1.16** |
|
13 week |
22.84±0.88 |
23±1.53 |
30±1.81* |
40.3±0.9*** |
Values presented as Mean±SE; **p≤0.05; **p≤0.01; ***p≤0.001
Calcium
Mean values of plasma concentration of calcium is given in Table 13. There was no alteration in the level of plasma calcium in acetamiprid treated rats compared to control rat up to 9th week of daily oral acetamiprid exposure. But at 13th week of acetamiprid exposure caused a significant reduction in plasma level of calcium in group IV as compared to group I.
Table 13: Effect of acetamiprid on plasma calcium for 13 weeks in SD rat
|
Acetamiprid |
||||
|
Calcium (mg/dl) |
Vehicle |
5 mg/kg |
20 mg/kg |
40 mg/kg |
|
1 week |
9.45±0.79 |
10.2±0.31 |
10.57±0.43 |
10.17±0.62 |
|
2 week |
10±1 |
10.1±0.71 |
10.09±0.31 |
8.95±0.52 |
|
5 week |
10.17±0.88 |
10.7±0.71 |
9.19±0.3 |
8.29±0.45 |
|
9 week |
10.34±0.78 |
10.2±0.72 |
7.84±0.24 |
7.77±0.46 |
|
13 week |
10.17±1.08 |
9.19±0.31 |
7.19±0.24 |
6.59±0.41* |
Values presented as Mean±SE; **p≤0.05
Phosphorus
There was no significant difference in plasma phosphorus concentration of acetamiprid-administered groups as compared to control group upto 5th week of administration. But at 9th week it was found to be significantly (p≤0.05) increased in group IV only compared to rats of control group. At 13 weeks of exposure group III and group IV showed significant increase in plasma phosphorus concentration compared to control group (Table 14).
Table 14: Effect of acetamiprid on plasma phosphorus for 13 weeks in SD rat
|
Acetamiprid |
||||
|
Phosphorus (mg/dl) |
Vehicle |
5 mg/kg |
20 mg/kg |
40 mg/kg |
|
1 week |
6.67±0.67 |
6.34±0.5 |
6.17±0.56 |
6.34±0.43 |
|
2 week |
6.84±0.75 |
6.67±0.5 |
6.67±0.48 |
7.17±0.31 |
|
5 week |
6.84±0.61 |
6.67±0.3 |
6.95±0.27 |
7.72±0.17 |
|
9 week |
6.5±0.57 |
7±0.35 |
7.5±0.25 |
8.39±0.32* |
|
13 week |
6.34±0.43 |
7.34±0.2 |
8.5±0.27** |
10.3±0.3*** |
Values presented as Mean±SE; *p≤0.05; **p≤0.01; ***p≤0.001
Sodium
A significant (P≤0.05) increase in sodium was observed in rats of group III & IV as compared to control rats in 5th weeks of acetamiprid administration. Nine weeks of exposure to acetamiprid, caused a significant increase in plasma sodium level in a dose dependent manner. There was also dose dependent and significant increase in the sodium level in all treated animal compared to rats of control animal. Data was presented in Table 15.
Table 15: Effect of acetamiprid on plasma sodium for 13 weeks in SD rat
|
Acetamiprid |
||||
|
Sodium (mEq/l) |
Vehicle |
5 mg/kg |
20 mg/kg |
40 mg/kg |
|
1 week |
152.34 ±8.5 |
152.34± 11.34 |
161.34± 11.21 |
167.34± 10.81 |
|
2 week |
149.34 ±12.28 |
154.17± 12.59 |
171.17± 11.71 |
177.17± 13.08 |
|
5 week |
151.34 ±6.03 |
165.67± 9.83 |
189± 7.88** |
203.67± 5.1*** |
|
9 week |
150.17 ±8.89 |
181.17± 10.86** |
203± 3.87*** |
222.17± 11.5*** |
|
13 week |
149.67 ±1.12 |
202.84± 2.03** |
232.84± 3.22*** |
250.5± 2.44*** |
Values presented as Mean±SE; **p≤0.01; ***p≤0.001
Potassium
The effect of the acetamiprid exposure after daily oral administration for 13 weeks to Sprague Dawley rats on plasma potassium is shown in Table 16. There was significant (***p≤0.001) increase in plasma potassium level in only group IV in 9th week, compared to rats of control group. Although there was no changes recorded up to 5 week of acetamiprid oral administration in SD rat but at 13 week there was dose dependent significant (*p≤0.05) increase in the level of plasma potassium in treated rats compared to control rat.
Table 16: Effect of acetamiprid on plasma potassium for 13 weeks in SD rat
|
Acetamiprid |
||||
|
Potassium (mEq/L) |
Vehicle |
5 mg/kg |
20 mg/kg |
40 mg/kg |
|
1 week |
4.09±0.24 |
4.09±0.24 |
4.17±0.31 |
4.17±0.53 |
|
2 week |
4.07±0.24 |
4.07±0.39 |
4.34±0.48 |
5.17±0.46 |
|
5 week |
4.17±0.25 |
4.34±0.22 |
4.59±0.4 |
5.25±0.2 |
|
9 week |
4.01±0.29 |
4.42±0.24 |
5±0.23 |
6.7±0.4*** |
|
13 week |
4.09±0.31 |
5.24±0.2* |
6.6±0.2*** |
8.9±0.3*** |
Values presented as Mean±SE; *p≤0.05; ***p≤0.001
Chlorine
Mean values of plasma concentration of chlorine was presented in Table 17. A dose dependent hyperchloremia was found to be observed in acetamiprid treated rat in this present experiment. There was significant increase in plasma chlorine level in all acetamiprid treated rat from 9th week onwards in comparison with control rat.
Table 17: Effect of acetamiprid on plasma chlorine for 13 weeks in SD rat
|
Acetamiprid |
||||
|
Chlorine(mEq/l) |
Vehicle |
5 mg/kg |
20mg/kg |
40mg/kg |
|
1 week |
105.17 ±1.31 |
107.84 ±1.63 |
108.67 ±2.28 |
110± 2.47 |
|
2 week |
103.67 ±1.36 |
113.17 ±2.68 |
126.17± 2.5 |
131.17 ±1.54 |
|
5 week |
105.5 ±1.41 |
128± 1.4 |
136± 2.44** |
140.5± 1.53*** |
|
9 week |
103.34 ±1.55 |
133.84 ±1.45** |
145.5± 2.84*** |
147.84± 2.29*** |
|
13 week |
104.34 ±2.37 |
135.5 ±1.26** |
147.67± 3.55*** |
156.67± 3.21*** |
Values presented as Mean±SE; **p≤0.01; ***p≤0.001
DISCUSSIONS
Body Weight
The results in the present study of decrease in the body weight in SD rats following oral exposure of acetamiprid were in agreement with Koller et al. (1976), who reported decreased body weight gain in mice exposed to pesticide, leptophos @ 0, 10, 100 and 500 ppm for 12 weeks. Body weight was significantly decreased in male and female mice in fenvalerate toxicity for 2 years (Parker et al., 1983). However Varshneya et al. (1992) did not find any effect of cypermethrin in rats on body weight gain. However, Mondal et al. (2010) reported decrease in body weight gain in subacute acetamiprid toxicity.
In the present study, reduced body weight gain might be an indication of direct toxicity or stressogenic activity of these compounds (Gowda et al., 1983; 1984 and 1985) in GI tract resulting in decreased appetite and absorption (Bhelonde and Ghosh, 2004). The reduction in body weight could also be attributed to anorectic properties of acetamiprid.
Feed Consumption
The reduced feed intake in treated animal compare to control rat in the present experiment is accordance with Mondal et al. (2010) who reported less feed consumption in acetamiprid intoxicated rat. Patel et al. (2014) also reported reduction in feed consumption in Wistar rat due to stressogenic activity of chemicals which corroborate the results of present findings.
Haematology
In the present study, acetamiprid, dissolved in water caused a statistically significant increase (P≤0.05) in neutrophil level but significant decrease in lymphocyte percentage count, thus acetamiprid could produce lymphocytopenia if administered orally for 13 weeks. It was suggested that compounds having benzene ring or other ring structure acted as hapten that combined with a protein constituent of leukocytes to form an antigen to which animal developed antibodies which was toxic to leukocytes causing either lysis or agglutination (Benjamin, 1978). Acetamiprid was also a ring structure compound and thus might have caused leukocytopenia. The acetamiprid might have also direct cytotoxic effect on leukocyte as also suggested in gentamicin toxicity in guinea pigs (Gupta and Verma, 1998). It therefore showed that with continuous administration of this insecticide to animal the principle function of phagocytes, which was to defend against invading microorganisms by ingesting and destroying them, thus contributing to cellular inflammatory processes, might be compromised (Staub, 1994). It should be noted that acetamiprid caused a significant decrease in the level of lymphocyte in all treated groups with significant increase in the level of neutrophils. Continuous exposure to this insecticide caused to lymphocytopaenia, which might have an immunosuppressive effect. The observed neutrophilia and lymphocytopenia might have occurred due to the adverse effect of insecticide on the normal functioning of bone marrow, stress (Jain, 1986) and/or due to varied factors responsible for the normal leukocyte balance (Platt, 1979).
Blood Chemistry
Significant increase in plasma AST activity in acetamiprid treated rats suggested an increased respiratory burst and mitochondrial involvement, as AST was chiefly a mitochondrial enzyme. Mitochondrion plays an important role in maintaining hepatocyte integrity and function, which might be hampered due to excessive physiologic stress (Hassanein, 2004). Activity of AST was high in acute and chronic liver injury (Tennant, 1997). Elevation in the AST could be associated with cell necrosis of many tissues. Pathology involving the skeletal or cardiac muscle and/or the hepatic parenchyma, allowed the leakage of large amount of this enzyme into blood (Kaneko, 1980). The elevation in AST produced by acetamiprid is an indication of tissue damage. Mondal et al. (2014) also reported increased AST activity in female Wistar rat after acetamiprid administration which was in well agreements with the present finding.
Alanine amino transferase was a key cytoplasmic enzyme present in liver and other cells. It was particularly useful in measuring hepatic necrosis, especially in small animals (Cornelius, 1989). Alanine amino transferase was considered as a marker of hepato cellular damage and in general ALT was considered a more sensitive indicator of liver cell injury than AST (Oser, 1976). Though AST and ALT were not known to have any function in the plasma, but their increase level in the blood indicate cellular damage and increased membrane permeability (Ramazzotto and Carlin, 1978) and their altered metabolism (Dinman et al., 1963). Since ALT was one of the specific assayable liver enzymes, its elevated level in the study may indicate hepatic damage caused by oral administration of acetamiprid. Although it was difficult to point the damage to any particular organ by acetamiprid, but increased levels of aminotransferases in rats may be attributed to liver damage, as a primary organ of biotransformation of acetamiprid.
Alkaline phosphatase, a brush border enzyme with its organic phosphatase esters mediated membrane transport (Gold et al., 1964). They were zinc metallo enzymes that are composed of two identical subunits arranged around an active centre. It was known to be involved in a variety of activities such as permeability, growth and cell differentiation (Shaffi et al., 1974). The elevation in plasma in ALP activities in SD rats are not in accordance with the findings of Premlata (2001) who reported a decline of ALP activity in rats following 28 days of oral administration of imidacloprid. Release of ALP usually occurs due to its increased synthesis brought about by variety of liver conditions (Seetharam et al., 1986). Significant increased levels of ALP in acetamiprid treated rats suggested alteration in membrane structure, as ALP was a plasma membrane enzyme.
In the present study hypoglycemia was observed on 5th week and there was a dose dependent decrease in glucose concentration after 5th week of oral administration of acetamiprid. The results of the present study showed that dose related decrease in level of blood glucose was in agreement with the observation of Jain and Punia (2006) in imidacloprid treated rats. Studies on rats have indicated that thyroid could be sensitive to acetamiprid. In 1998, US EPA report has indicated that imidacloprid could an affect thyroid function in animals, which may cause decrease in blood glucose levels. As acetamiprid and imidacloprid both are nitroguanidine insecticide and have structural similarity, acetamiprid can also affect thyroid function. Hypoglysemia was also reported by Mondal et al. (2014) in acetamiprid induced toxicity in female wistar rat.
The acetamiprid caused significant (P ≤ 0.05) elevation in the levels of albumin with decreased globulin. The increase in albumin may be due to dehydration following refusal of animals to drink water as a result of oral administration of acetamiprid (Mondal et al., 2012). Decreased levels of globulin indicate that the immune competence of the animals will be easily compromised. As a matter of fact, lymphopaenia accompanied by low globulin level, may lead to immunosuppression. In case of decreased globulin level, diseases characterized by deficiency of immunoglobulin, such as agammaglobulinaemia selective IgM, IgA and IgG deficiencies and transient hypogammaglobulinaemia, may lead to low level globulin (Duncan et al., 1994). Acetamiprid might possess immunosuppressive properties as well as causing inflammatory effects.
Increased bilirubin in dose dependant manner over the experimental weeks indicated hepatocellular damage which regulated the free bilirubin in plasma. It might be due to reduced feed and water intake which was found in present experiment (Ghofrani et al., 2010; Ameri et al., 2011).
Increased level of creatinine levels in the acetamiprid treated groups may be due to the possible nephrotoxic effect of acetamiprid. Significant increase in blood creatinine level might be correlated to the renal damage or skeletal muscle necrosis or atrophy of skeletal muscle (Pennington, 1971). It could also be explained by our observation that severe necrotic changes were detected in kidney. This finding was also in agreement with Erdem et al. (2006). Significant increase of creatinine level of blood suggested evidence of marked impairment of kidney function (Oser, 1976).
Increase in blood urea nitrogen level indicated that acetamiprid has toxic effect on glomerular filtration. Increased blood urea level have been reported in subacute benfuracarb toxicity in wistar rats (Bhilegaonkar et al., 1995) indicating renal dysfunction in the affected animals.
Effects of acetamiprid on pancreas and kidney may also be responsible for hypocalcaemia (Brar et al., 2002). It might be due to renal failure or osteoclastic lesions during chronic acetamiprid toxicity study. An increase in serum calcium concentration was observed in rats treated with 31.80 mg/kg fenvalerate (He et al., 2006).
Augmented phosphorus level in plasma may be due to dehydration (Sastry, 1985). Oral administration of acetamiprid in distilled water solution might have caused refusal of animals to drink water leading to dehydration.
Calcium and phosphate metabolism are markedly altered during uraemia and are involved in development of renal secondary hyperparathyroidism in monogastrics (Kaneko et al., 1999). It seemed that in course of renal failure there was an analytically imperceptible hyperphosphatemia and hypocalcemia. Hyperphosphatemia observed in rats of group IV might also be due to rhabdomyolysis. The hyperphosphatemia was due to decreased glomerular filtration rate. The hypocalcemia may be a direct physiochemical effect of hyperphosphatemia or, a deficiency of active forms of vitamin D or both. The hypocalcemia stimulates parathyroid hormone release, which enhanced the calcium level in the blood.
The increase sodium concentration was correlated with the water loss, which was more prominent in high dose group. Due to kidney damage excretion of ammonia through urine is hampered which in turn cause uraemia, leading to anoxic condition in the tissues. Decreased oxygen pressure in the tissue affect ATP production, which is necessary for energy dependent Na-K-ATPase pump in cell membrane. As a result potassium comes out of the cell and sodium went inside the cell along with water leading to hydropic degeneration and subsequently there was rupture of the cells resulting in hypernatremia and hyperkalemia (Brar et al., 2002).
There were hyperchloremia in all the acetamiprid treated rats in a dose dependent manner. This might be due to dehydration and compensatory respiratory alkalosis. Most of the chloride in the body comes from table salt (sodium chloride) in the diet. Chloride was absorbed by the intestine during food digestion. Any excess chloride was passed out of the body through the urine. Chloride levels in the blood generally rise and fall along with sodium levels in the blood. The amount of chloride in the blood was indirectly regulated by the hormone aldosterone, which also regulates the amount of sodium in the blood. Elevations in chloride might be associated with diarrhoea, certain kidney diseases and over activity of the parathyroid gland (Brar et al., 2002).
CONCLUSIONS
From the present study it can be concluded that chronic acetamiprid intoxication caused lymphocytopenia in SD rats. Exposure of acetamiprid for 13 weeks, even at dose range selected in this experiment, altered the level of AST, ALT, ALP, bilirubin, BUN, Creatinine, phosphorus, Sodium, Potasium and chlorine.
ACKNOWLEDGEMENT
Authors acknowledge all kind of support from Dean, Faculty of VAS, WBUAFS and also thankfull to HOD, Department of Veterinary Pathology for providing related facilities.
Conflict of Interest
Authors declare that there is no conflict of interest.
Author’s Contribution
Samiran Mondal and Sunit Kumar Mukhopadhayay designed, executed and did all assays in the experiment. Sanjit Kumar and Partha Sarathi Mandal collected samples in the experiment. Saktipada Pradhan and Sreerupa Biswas analyzed data of this study. Kamal Purohit prepared and reviewed the manuscript.
REFERENCE


