Advances in Animal and Veterinary Sciences
Research Article
Adv. Anim. Vet. Sci. 3 (7): 384 - 394
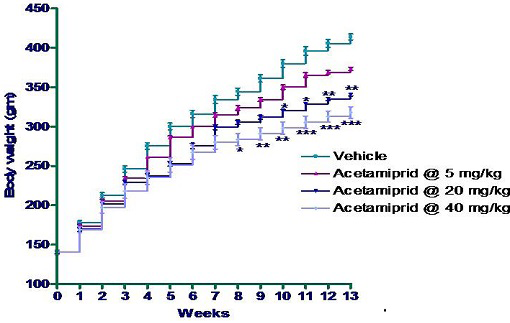
Figure 1
Stair graph showing effect of acetamiprid on weekly body weight in experimental group
*p≤0.05; **p≤0.01; ***p≤0.001
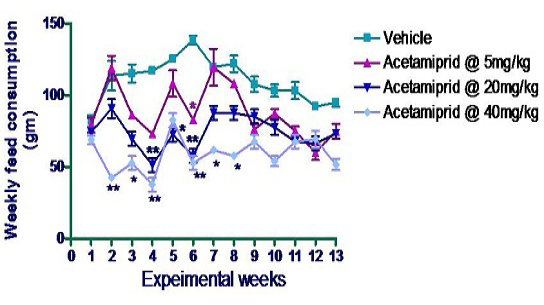
Figure 2
Line graph showing effect of acetamiprid on weekly feed consumption in experimental group
*p≤0.05; **p≤0.01


