Advances in Animal and Veterinary Sciences
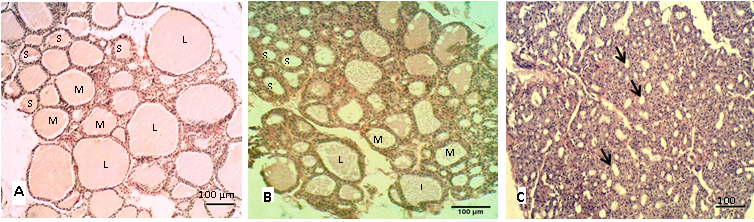
Sections of thyroid gland in adult, (A) Control group; (B) group eating mixed feed with cruciferous vegetable; (C) group eating only cruciferous vegetable. Showing the thyroid follicles in different size, (L) Large size, (M) Medium size, (S) Small size. H & E stain
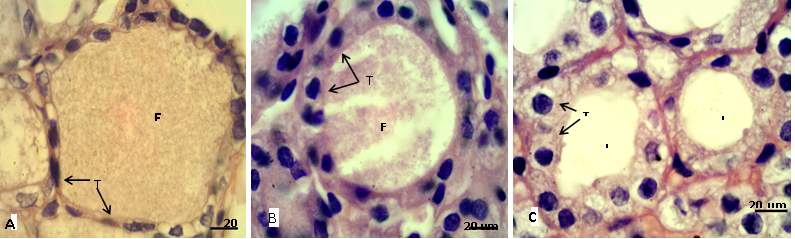
Sections of thyroid gland in adult; (A) Control group, showing flattened thyrocytes (T) with homogenous cytoplasm and the follicular colloid (FC) filled the follicular lumen; (B) group eating mixed feed with cruciferous vegetable, showing cuboidal thyrocytes (T) and the follicular colloid (FC) partially filled the follicular lumen; (C) group eating only cruciferous vegetable, showing cuboidal to columnar thyrocytes (T) with vacuolated cytoplasm and the follicular lumen (L) empty from colloid. H & E stain.
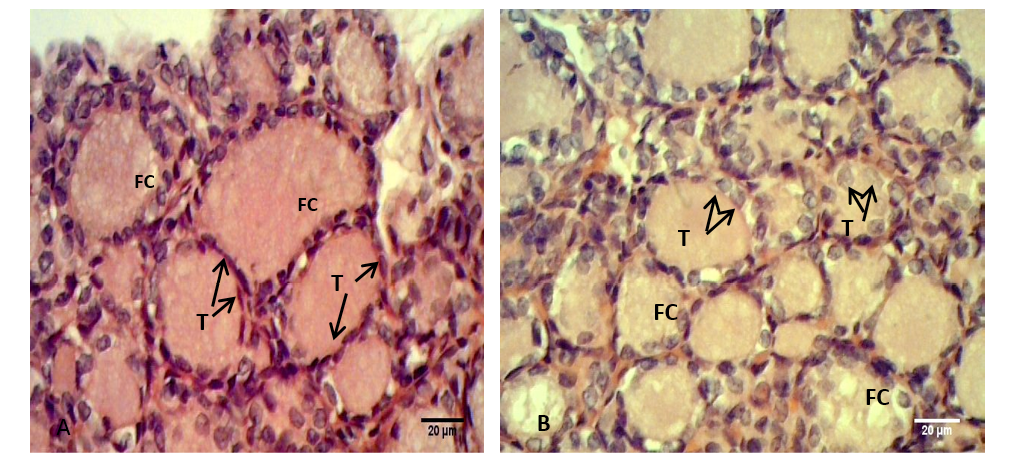
Sections of thyroid gland in Kit; (A) Control group, showing flattened to cuboidal thyrocytes (T) with homogenous cytoplasm and the follicular colloid (FC) filled the follicular lumen; (B) group their mother’s eating mixed feed with cruciferous vegetable, showing cuboidal thyrocytes (T) and the follicular colloid (FC) had foamy appearance. H & E stain.
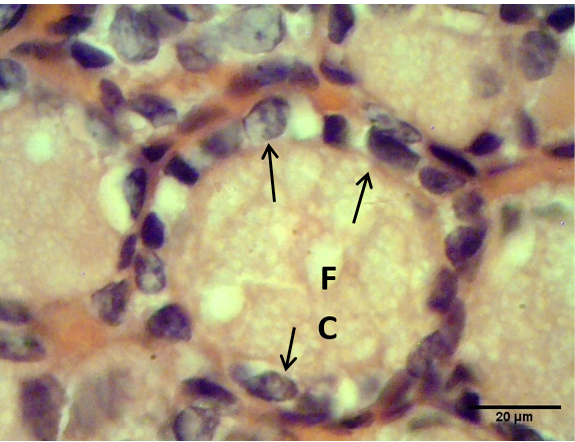
Sections of thyroid gland in Kit from group (B), showing cuboidal thyrocytes (arrows) and the follicular colloid (FC) that filled the follicular lumen had foamy appearance. H & E stain
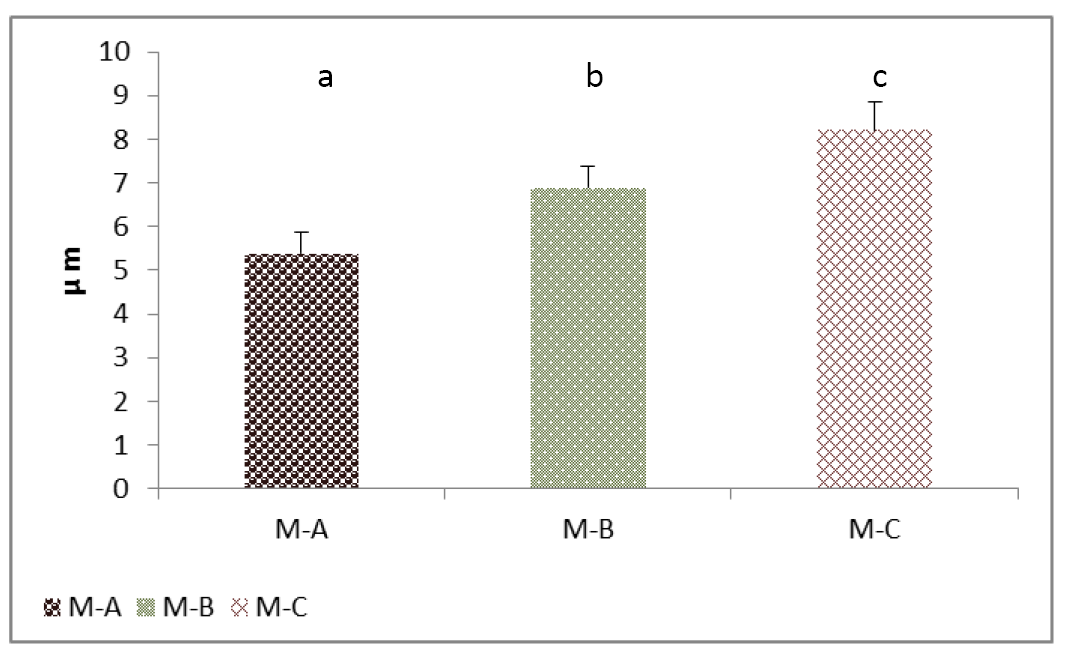
Cell height (Thyrocytes) of thyroid gland of the mature rabbit. Where the (M.A) control group, (M.B) group eating mixed feed with cruciferous vegetable, (M.C) group eating only cruciferous vegetable. Values are means ± SD, N= 8. Different superscript letter indicating significant (P<0.05) differences.
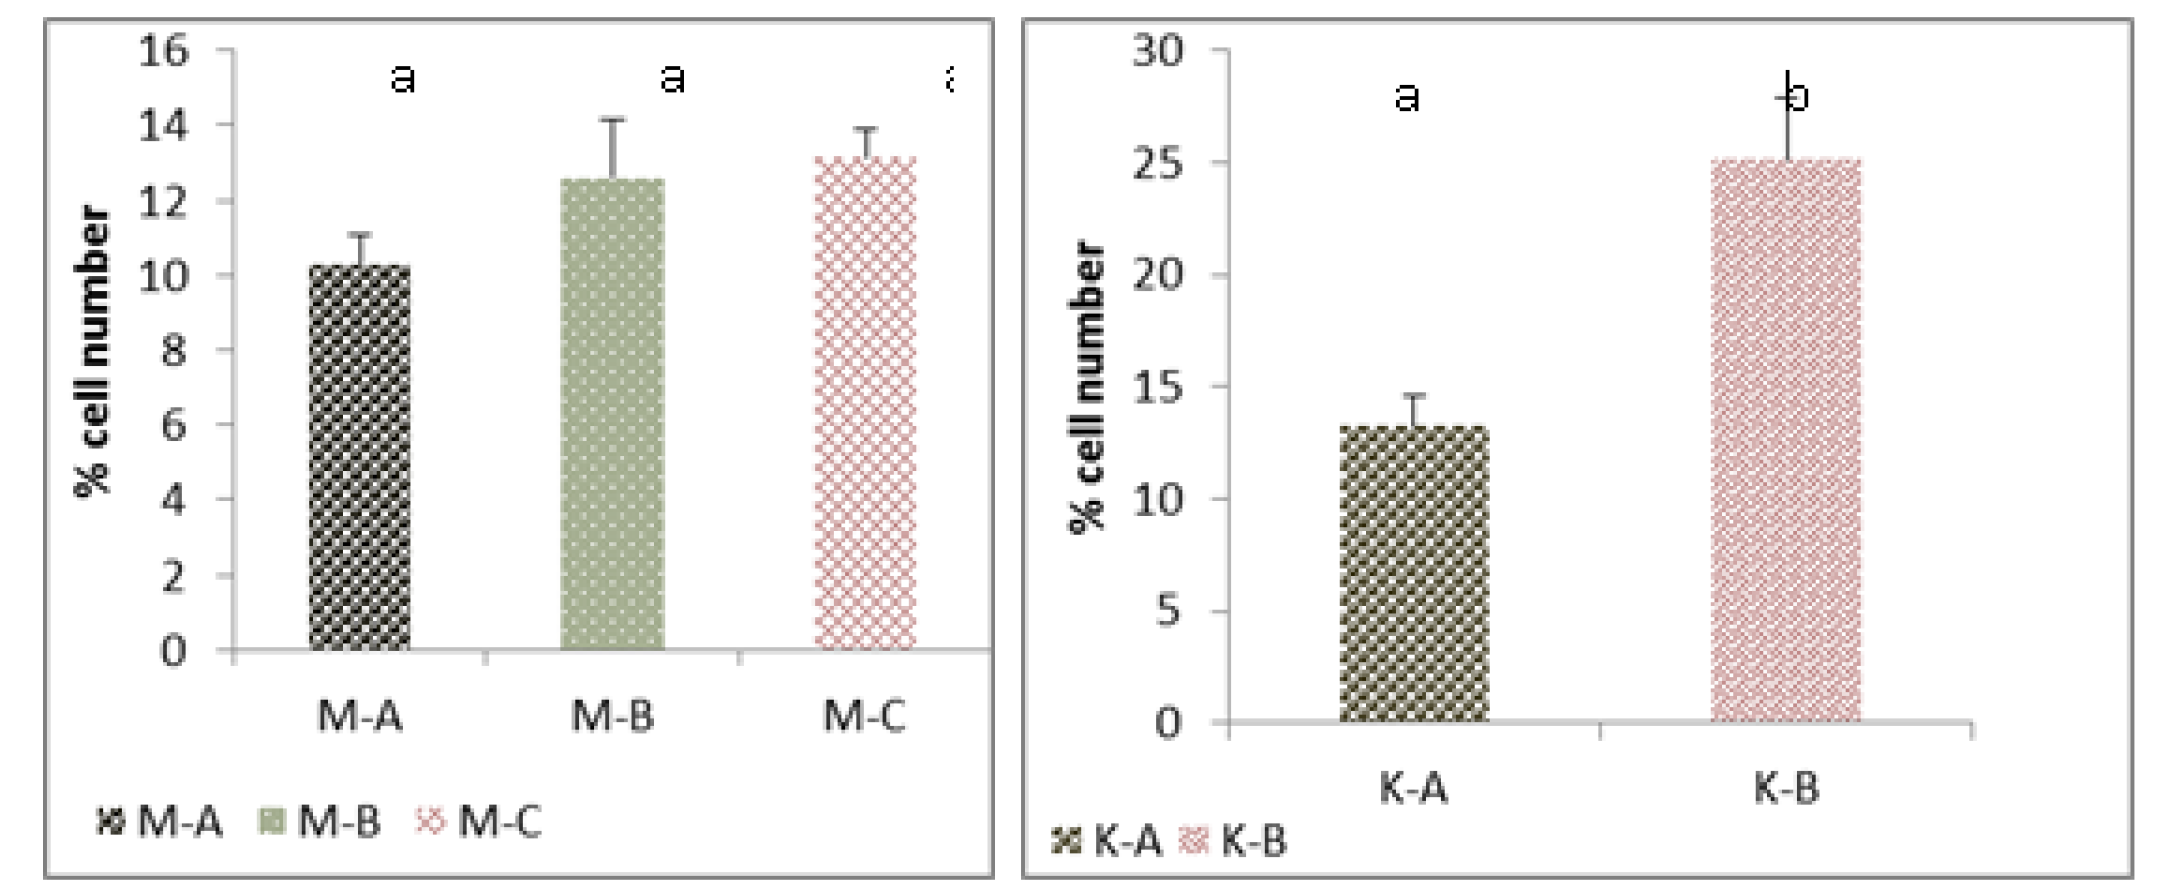
Cell number (Thyrocytes) of thyroid gland of the mature rabbit (Left) and their kit (Right). Where the (M.A) mature control group, (M.B) mature group eating mixed feed with cruciferous vegetable, (M.C) mature group eating only cruciferous vegetable. (K.A) Kit from control group, (K.B) kit from group (B). Values are means ± SD, N= 8. Different superscript letter indicating significant (P<0.05) differences
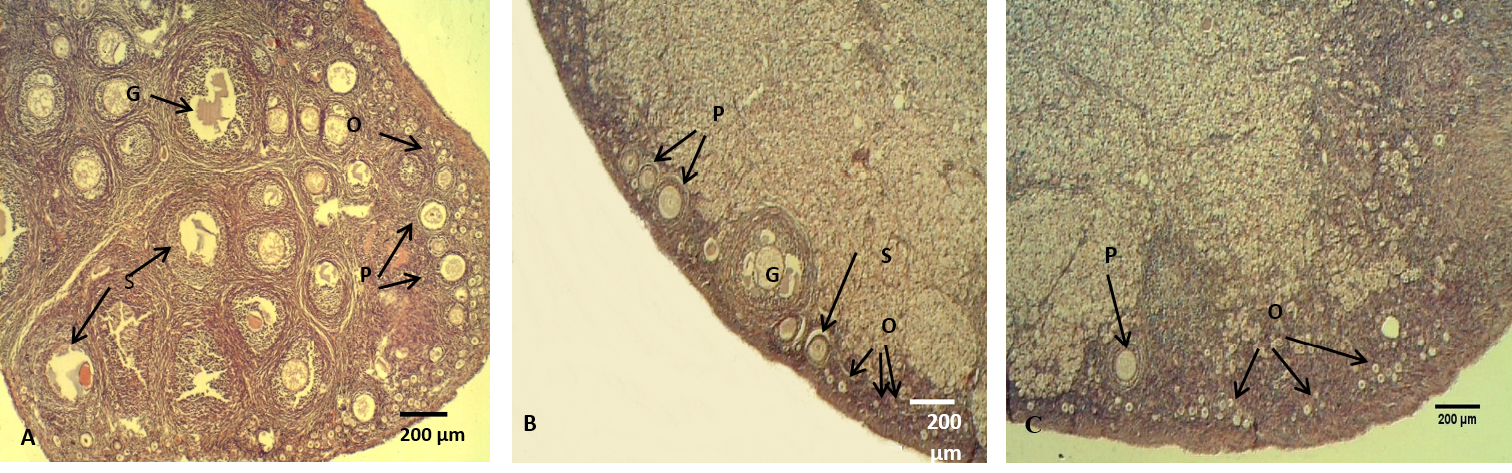
The ovary of adult rabbit; (A) Control group, showing high ovarian activity; (B) group eating mixed feed with cruciferous vegetable, showing low in ovarian activity; (C) group eating only cruciferous vegetable, showing lower ovarian activity. Where (O) Oocytes (P) Primary ovarian follicle, (S) Secondary ovarian follicles, (G) Mature ovarian follicles. H & E stain
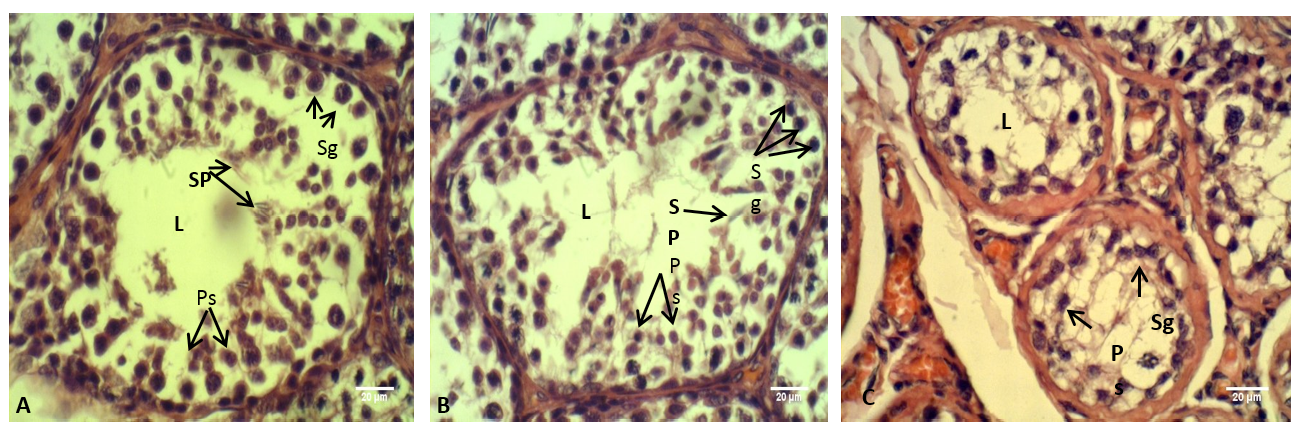
The testis of adult rabbit; (A) Control group, showing the epithelium of the seminiferous tubules with various stages of spermatogenesis; (B) group eating mixed feed with cruciferous vegetable, showing not typical arrangement of the spermatogenic cells; (C) group eating only cruciferous vegetable, showing spermatogenic cells were clustered together. Where (L) Lumen of seminiferous tubules (Sp) Spermatid, (Ps) Primary spermatozoa, (Sg) Spermatogonia. H & E stain


