Advances in Animal and Veterinary Sciences
Research Article
Adv. Anim. Vet. Sci. 3 (3): 143 - 150
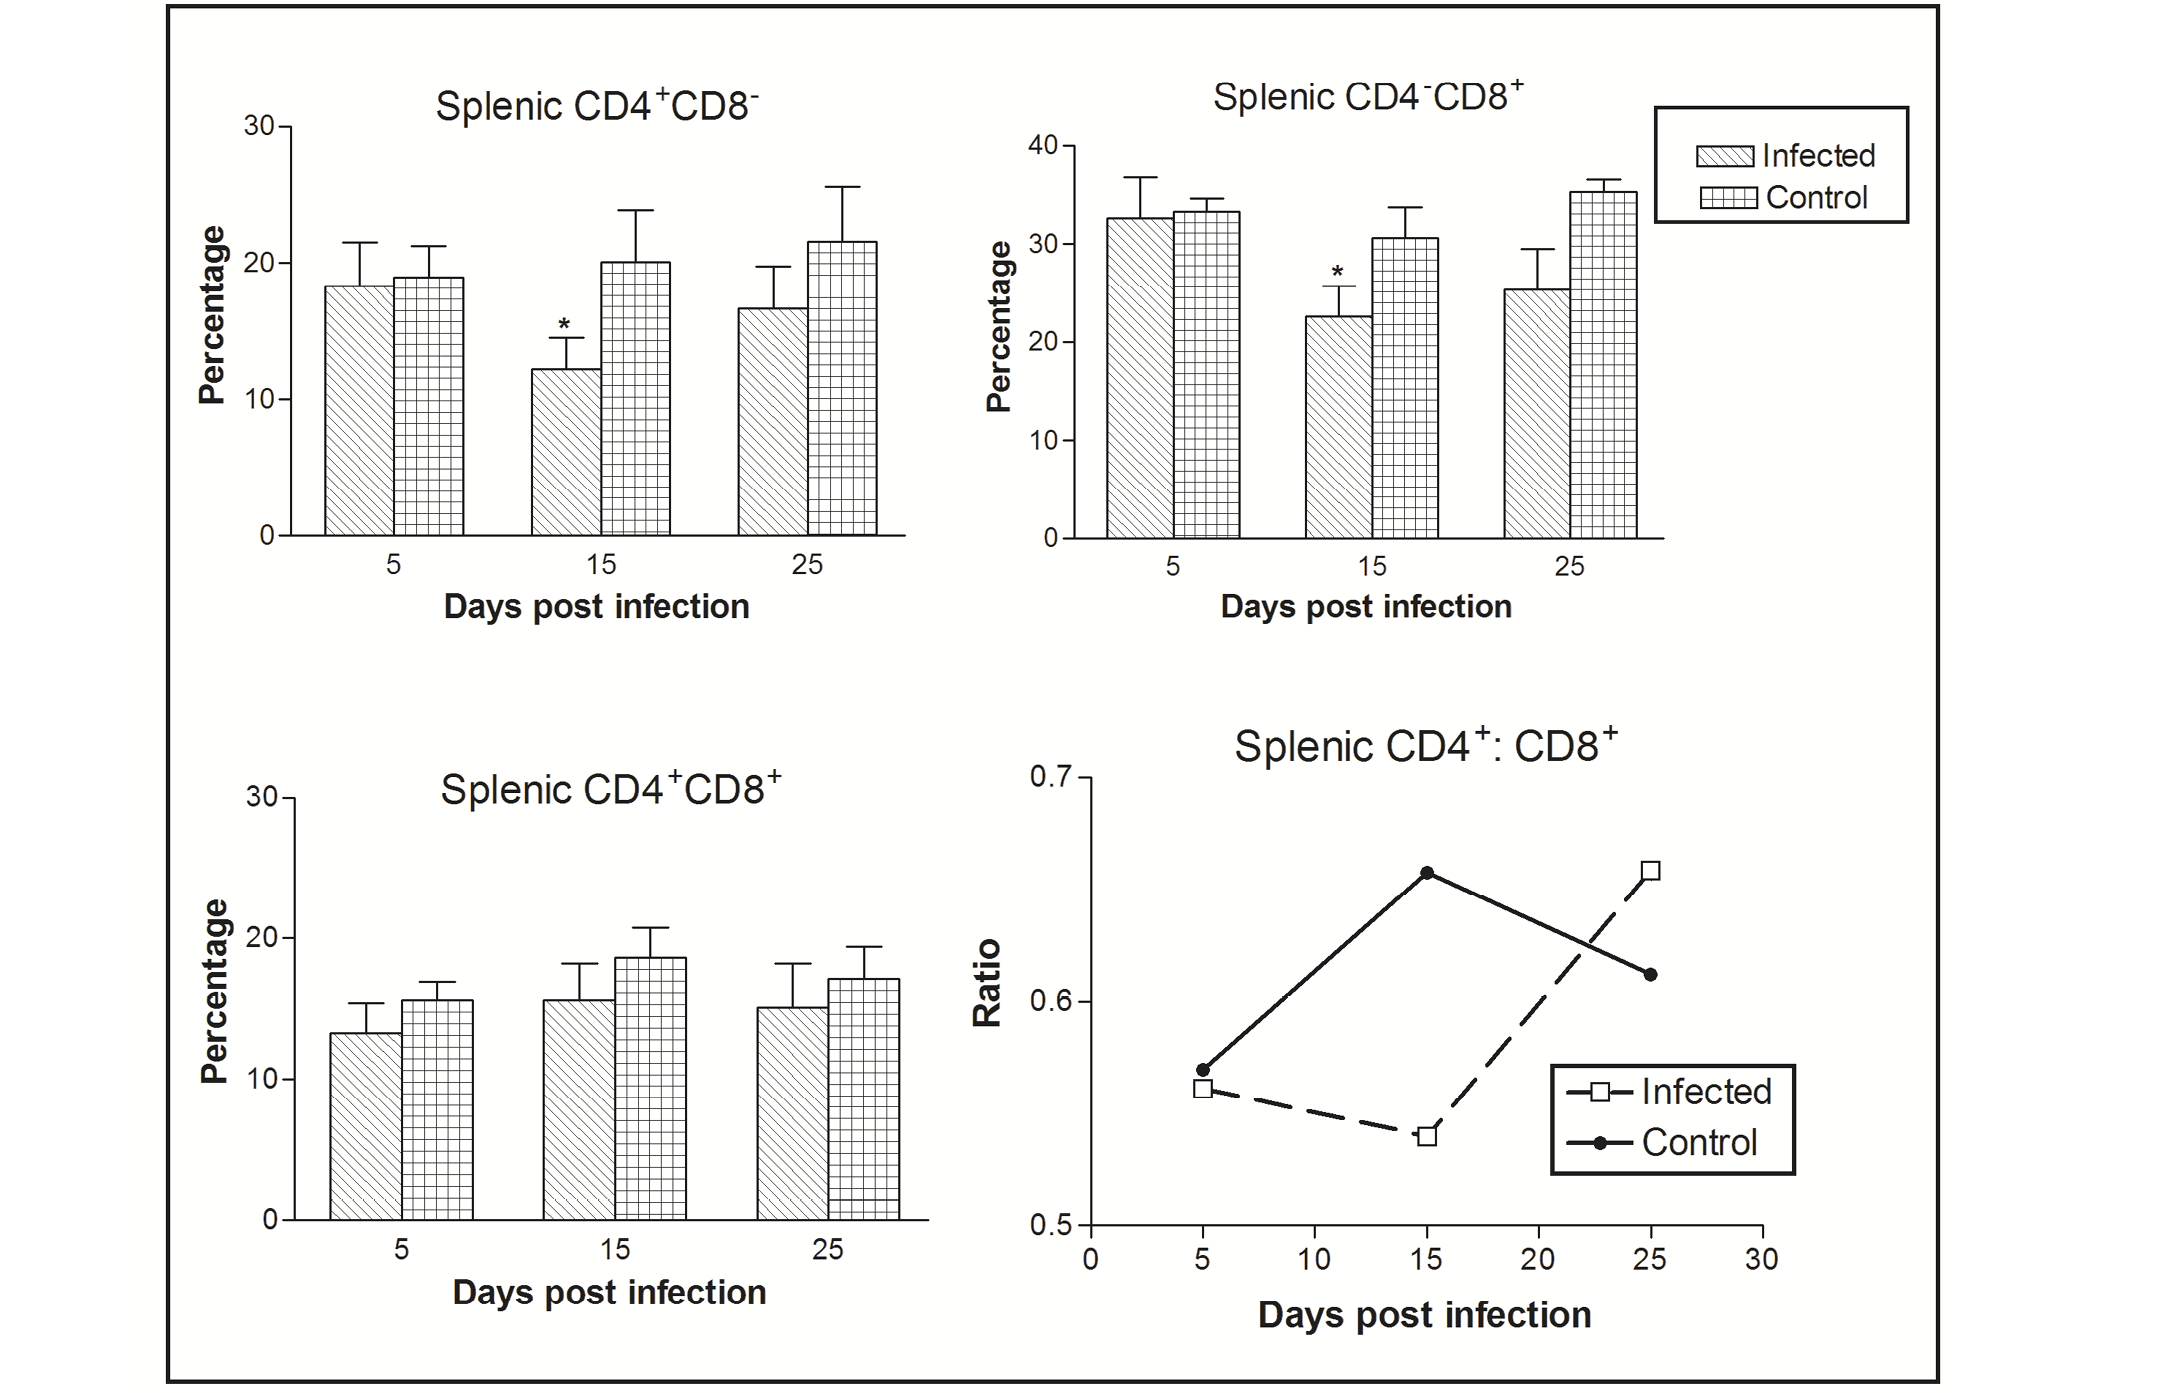
Figure 1
Effect of CIAV infection on splenic T lymphocytes in 6-week-old infected chicks at various post infection days. Values are represented as Mean ± SD, * p <0.05
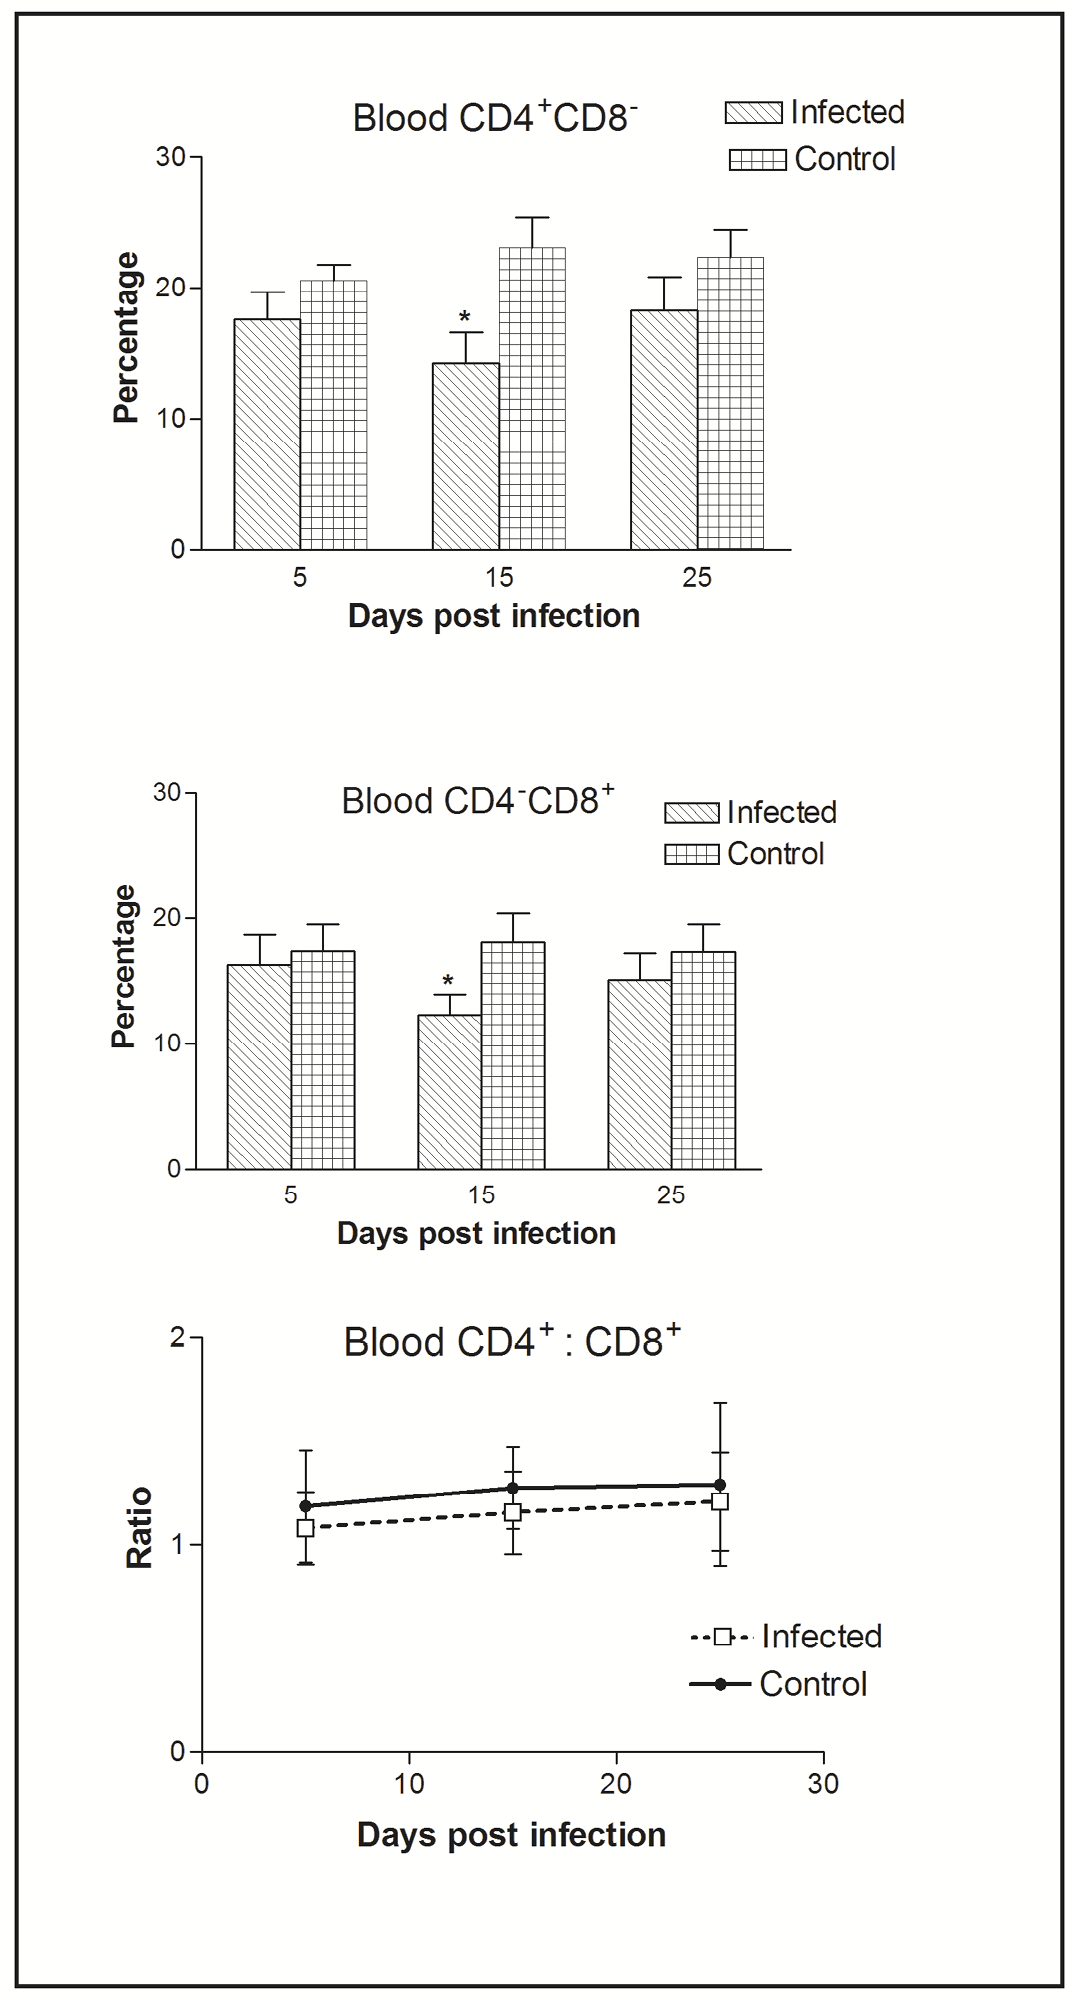
Figure 2
Effect of CIAV infection on T lymphocytes in blood at various post infection days. Values are represented as Mean ± SD, * p <0.05.
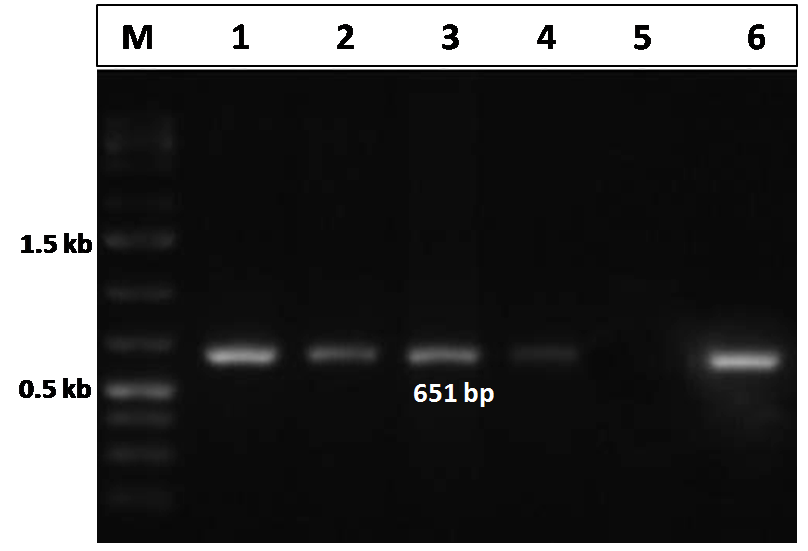
Figure 3
Confirmation of CIAV infection by PCR amplification of the VP2 gene of CIAV in the experimentally infected birds.
Lane1, 2, 3, 4: tissues samples from chicks of CIAV infected group; Lane 5: Negative control; Lane 6: CIAV positive control; Lane M: 1Kb DNA ladder.


