Advances in Animal and Veterinary Sciences
Research Article
Prediction of Fortnightly Test-Day Milk Yields Using Four Different Lactation Curve Models in Indian Murrah Buffalo
Saroj Kumar Sahoo, Avtar Singh, Pushp Raj Shivahre, Manvendra Singh, Soumya Dash, Shakti Kant Dash
Dairy Cattle Breeding Division, National Dairy Research Institute (NDRI), Karnal, Haryana-13200, India.
Abstract | The present investigation was carried out using data on 18871 fortnightly test day milk yield (FTDMY) records during first lactation of 961 Murrah buffaloes calved during 1977-2012 maintained in an organized farm at National Dairy Research Institute, Karnal. The least squares means of the FTDMY ranged from 2.35kg to 7.92kg. The relative efficiency of four lactation curve models via. Gamma-type function (GF), Exponential function (EF), Mixed log function (MLF) and polynomial regression function (PRF) were compared. PRF described the highest coefficient of determination (R2) (99.78%) and with least value (0.02kg) of root mean squares error (RMSE), whereas, least coefficient of determination (93.13%) was observed in Gamma-type function having maximum (0.1kg) RMSE value suggesting PRF being best mathematical model for prediction of FTDMYs in Murrah buffaloes.
Keywords | FTDMYs, Lactation curve, Gamma-type function, Exponential function, Mixed log function, Polynomial regression function, Murrah
Editor | Kuldeep Dhama, Indian Veterinary Research Institute, Uttar Pradesh, India.
Received | November 24, 2014; Revised | November 27, 2014; Accepted | November 28, 2014; Published | December 01, 2014
*Correspondence | Saroj Kumar Sahoo, National Dairy Research Institute, Karnal, Haryana-13200, India; Email: saroj6804@gmail.com
Citation | Sahoo SK, Singh A, Shivahre PR, Singh M, Dash S, Dash SK (2014). Prediction of fortnightly test-day milk yields using four different lactation curve models in Indian Murrah Buffalo.. Adv. Anim. Vet. Sci. 2 (12): 647-651.
DOI | http://dx.doi.org/10.14737/journal.aavs/2014/2.12.647.651
ISSN (Online) | 2307-8316; ISSN (Print) | 2309-3331>
Copyright © 2014 Sahoo et al. This is an open access article distributed under the Creative Commons Attribution License, which permits unrestricted use, distribution, and reproduction in any medium, provided the original work is properly cited.
INTRODUCTION
Lactation curve is the graphical representation of milk yield against time (Brody et al., 1923). Dairy cattle and buffaloes with more stable lactation curve are more persistent than those which show a rapid increase in the daily milk yield from calving to peak followed by a rapid decline. Very scanty work on lactation curve has been reported in Murrah buffaloes, the best dairy buffalo breed of India. Hence, the present investigation has been proposed to fit and compare the lactation curve models for describing the shape of the lactation curve in Murrah buffaloes and prediction of fortnightly test day milk yields.
MATERIALS AND METHODS
Data of 18871 fortnightly test day milk yield (FTDMY) records during first lactation of 961 Murrah buffaloes calved during 1977-2012 at the National Dairy Research Institute, Karnal were collected. The climate of the farm is subtropical in nature. The lowest temperature falls to 2°C during the winter months, whereas the highest temperature goes up to 45°C during the summer. The annual rainfall is about 760 to 960mm, out of which most of the rainfall is received during the months of July and August. The relative humidity ranges from 41% to 85%.
A total of 21 fortnightly test day milk yield records (6th day, 20th day, 35th day,. . . , 305th day) were taken at an interval of 15days from daily milk yield recording register. The data were used to estimate lactation curve parameters of the four lactation curve models via. Gamma-type function (GF), Exponential function (EF), Mixed log function (MLF) and polynomial regression function (PRF) for developing the prediction model for estimation of fortnightly test day milk yields in Murrah buffaloes.
1. Gamma-type function: (Wood, 1967)
Yt = atbe-ct
In its logarithmic form, this reduces to
ln (Yt) = ln (a) + b ln (t) – ct
2. Exponential function (Catillo, 2002)
Yt = a+be-0.70t+ct
3. Mixed log function (Guo and Swalve, 1995)
Yt=a+bt0.5+clogt
In the models, Yt = average daily yield in the tth test day of lactation; a = initial milk yield just after calving; b= ascending slope parameter up to the peak yield; c=descending slope parameter and t = length of time since calving.
4. Polynomial regression function (Ali and Schaeffer, 1987)
Yt=a+bx+cx2+dlog (1/x)+elog (1/x)2
In this model, Yt = Average milk yield in tth week of lactation, a = Associated with peak yield, b & c = Associated with the decreasing slope, d & e = Associated with the increasing slope, x = t /305
RESULTS AND DISCUSSION
The least squares means of the FTDMYs were calculated for adjustment of effect of non-genetic factors (season, year of calving and age at first calving groups). The average FTDMYs increases from 3.93±0.05 kg in first test day (6th day of lactation) to a peak yield of 7.92±0.06 kg on test day 4 (50th day of lactation), and subsequently declined to 2.35±0.07 kg in last test day. In accordance with the present findings, Chakraborty et al. (2010) observed the minimum least-squares means as 4.43 ± 0.09 kg on monthly test day1 (MTD 1) (6th day) and maximum as 8.11 ± 0.25 kg on MTD 3 (65th day) in Murrah buffaloes.
Various lactation curve parameters (a, b, c, d and e) were estimated to fit into the mathematical models to obtain the prediction equation for FTDMYs (Table 1). The four lactation curve functions (Table 2) were developed after fitting the values of the lactation curve parameters for predicting FTDMYs.
Table 1: Estimated lactation curve parameters of different functions in Murrah buffalo
|
Lactation curve functions |
Parameters |
|||||
|
a |
b |
c |
d |
e |
||
|
1. |
GF |
4.52 |
0.81 |
0.14 |
- |
- |
|
2. |
EF |
10.38 |
-12.68 |
-0.34 |
- |
- |
|
3. |
MLF |
10.97 |
-7.22 |
8.29 |
- |
- |
|
4. |
PRF |
2.31 |
1.61 |
-0.04 |
-4.1 |
-3.14 |
Table 2: Different lactation curve functions with parameters for prediction of FTDMY in Murrah buffaloes
|
Sl. No. |
Function |
Parameters of function |
R2 (%) |
RMSE (kg) |
|
1. |
GF |
Yt = 4.52*t0.81e-0.14*t |
93.13 |
0.1 |
|
2. |
EF |
Yt = 10.38-12.68*e-0.70*t -0.34*t |
94.35 |
0.09 |
|
3. |
MLF |
Yt = 10.97-7.22*t0.5+8.29log(t) |
96.96 |
0.06 |
|
4. |
PRF |
Yt= 2.31+1.61*(t/305)-0.04*(t/305)2-4.1*log(305/t)-3.14*log(305/t)2 |
99.78 |
0.02 |
Table 3: Predicted FTDMY and error (kg) of different lactation curve functions in Murrah buffaloes
|
FTDMY |
Observed value(LS means) |
GF |
EF |
MLF |
PRF |
||||
|
Predicted |
Error |
Predicted |
Error |
Predicted |
Error |
Predicted |
Error |
||
|
TD 1 |
3.93 |
3.94 |
0.01 |
3.75 |
-0.18 |
3.75 |
-0.18 |
3.88 |
-0.05 |
|
TD 2 |
6.49 |
6.02 |
-0.47 |
6.58 |
0.09 |
6.50 |
0.01 |
6.70 |
0.21 |
|
TD 3 |
7.60 |
7.29 |
-0.31 |
7.82 |
0.22 |
7.56 |
-0.04 |
7.50 |
-0.10 |
|
TD 4 |
7.92 |
8.02 |
0.10 |
8.27 |
0.35 |
8.01 |
0.09 |
7.77 |
-0.15 |
|
TD 5 |
7.90 |
8.38 |
0.48 |
8.32 |
0.42 |
8.16 |
0.26 |
7.84 |
-0.06 |
|
TD 6 |
7.79 |
8.48 |
0.69 |
8.18 |
0.39 |
8.12 |
0.33 |
7.82 |
0.03 |
|
TD 7 |
7.69 |
8.38 |
0.69 |
7.94 |
0.25 |
7.98 |
0.29 |
7.75 |
0.06 |
|
TD 8 |
7.59 |
8.15 |
0.56 |
7.65 |
0.06 |
7.77 |
0.18 |
7.63 |
0.04 |
|
TD 9 |
7.42 |
7.83 |
0.41 |
7.33 |
-0.09 |
7.51 |
0.09 |
7.49 |
0.07 |
|
TD 10 |
7.28 |
7.44 |
0.16 |
7.01 |
-0.27 |
7.21 |
-0.07 |
7.30 |
0.02 |
|
TD 11 |
7.04 |
7.02 |
-0.02 |
6.68 |
-0.36 |
6.88 |
-0.16 |
7.08 |
0.04 |
|
TD 12 |
6.86 |
6.57 |
-0.29 |
6.35 |
-0.51 |
6.54 |
-0.32 |
6.82 |
-0.04 |
|
TD 13 |
6.62 |
6.12 |
-0.50 |
6.01 |
-0.61 |
6.18 |
-0.44 |
6.52 |
-0.10 |
|
TD 14 |
6.09 |
5.67 |
-0.42 |
5.68 |
-0.41 |
5.81 |
-0.28 |
6.18 |
0.09 |
|
TD 15 |
5.77 |
5.24 |
-0.53 |
5.34 |
-0.43 |
5.43 |
-0.34 |
5.79 |
0.02 |
|
TD 16 |
5.40 |
4.82 |
-0.58 |
5.01 |
-0.39 |
5.05 |
-0.35 |
5.36 |
-0.04 |
|
TD 17 |
4.93 |
4.42 |
-0.51 |
4.67 |
-0.26 |
4.67 |
-0.26 |
4.87 |
-0.06 |
|
TD 18 |
4.38 |
4.04 |
-0.34 |
4.33 |
-0.05 |
4.28 |
-0.10 |
4.34 |
-0.04 |
|
TD 19 |
3.77 |
3.68 |
-0.09 |
4.00 |
0.23 |
3.88 |
0.11 |
3.75 |
-0.02 |
|
TD 20 |
3.07 |
3.35 |
0.28 |
3.66 |
0.59 |
3.49 |
0.42 |
3.10 |
0.03 |
|
TD 21 |
2.35 |
3.04 |
0.69 |
3.33 |
0.98 |
3.10 |
0.75 |
2.40 |
0.05 |
The GF gave the lowest R2 value (93.13%), with thehighest RMSE value (0.1 kg). Dimauro et al. (2005)reported similar R2 value (93.7%) in Italian water buffaloes using this function, whereas an R2 value of 96% has been reported by Kumar and Bhat (1979) and Aziz et al. (2006) in Indian buffaloes and Egyptian buffaloes, respectively. The EF gave a higher R2 value (94.35%) with a comparatively lower RMSE value (0.09 kg). Similar R2 value (94.4%) was also reported in Italian water buffaloes (Dimauro et al., 2005). The R2 and RMSE values from MLF were still better i.e. 96.96% and 0.06 kg, respectively. In accordance with this finding, an R2 value of 96.7% was reported by Kumar (2007) in Murrah buffalo. The PRF gave the highest R2 value (99.78%) and the lowest RMSE value (0.02 kg) for Murrah buffaloes in the present study. In Italian water buffaloes, Dimauro et al. (2005) reported R2-value of 96.7% using this function.
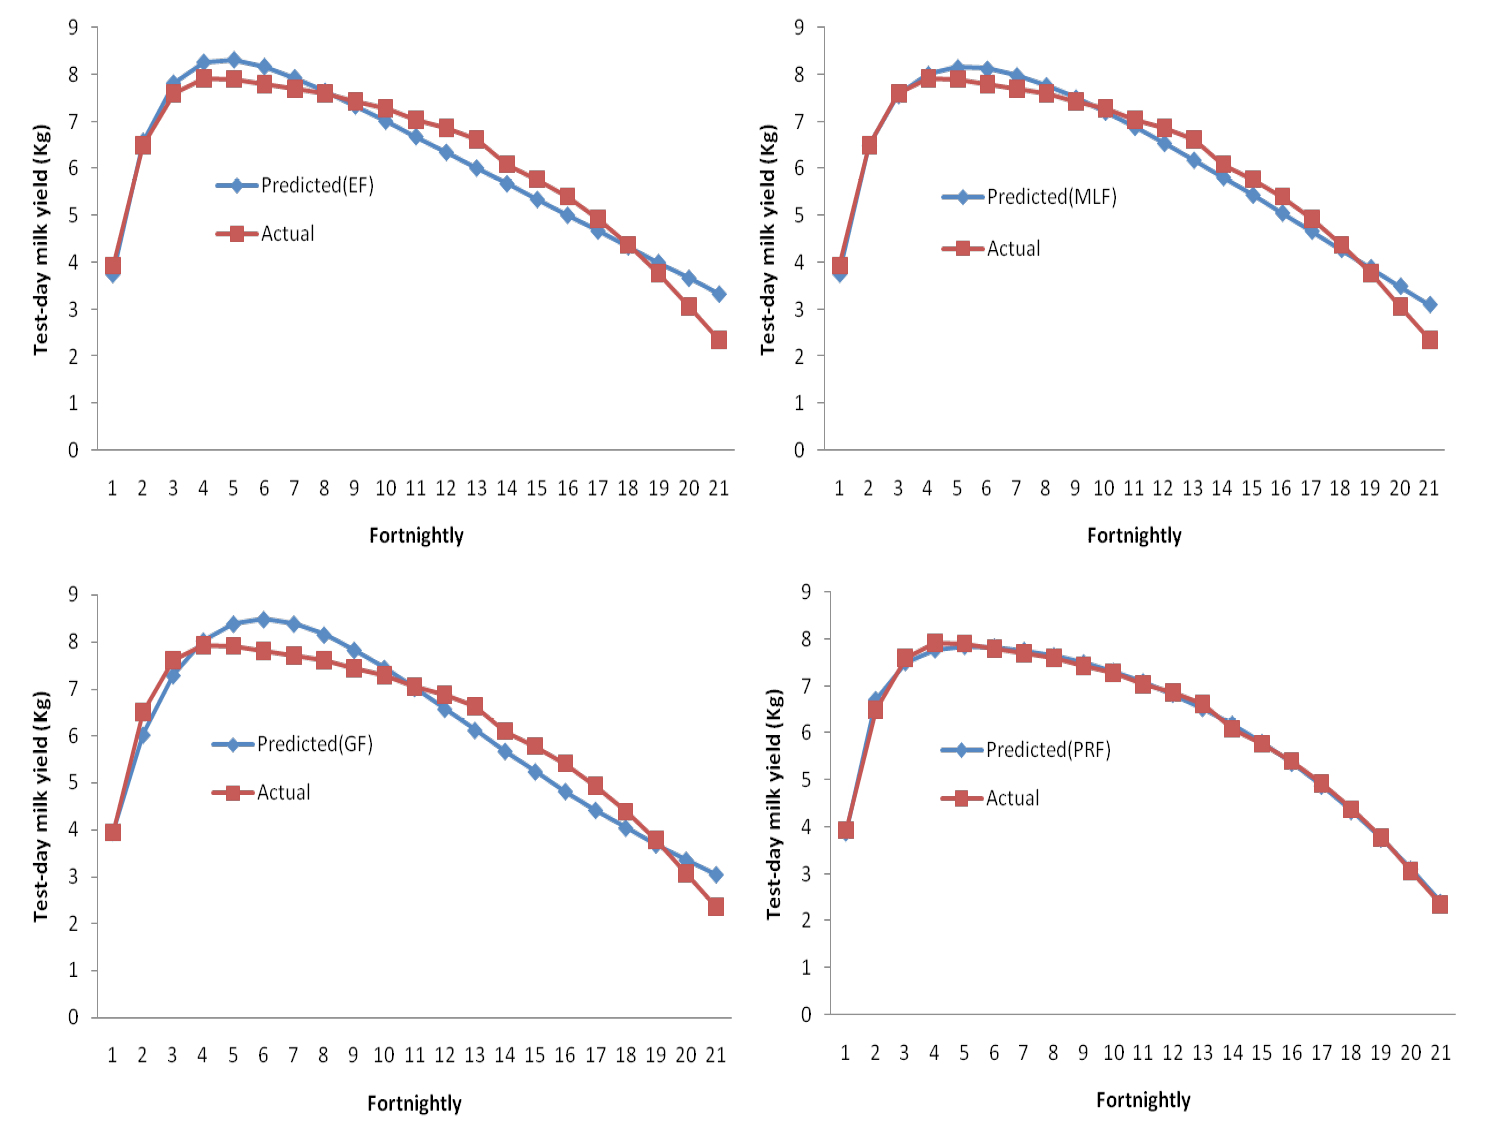
PRF which explained highest coefficient of determination value with lowest root mean squares error predicted the peak fortnightly test day milk yield to be 7.84 kg in the 5th test day of lactation. EF and MLF also predicted the peak yield as 8.32 kg and 8.16 kg in 5th test day of lactation, respectively. However, by GF the peak yield was found to be 8.48 kg in 6th test day of lactation. In Italian water buffaloes using GF, EF and PRF, Dimauro et al. (2005) reported peak yield of 10.9kg, 11.3kg and 11.5kg in 33rd, 26th and 29th day of lactation, respectively. The predicted and actual fortnightly test day milk yield records of different functions have been presented in table 3.
The overall observed and predicted FTDMYs for all 4 lactation curve functions were plotted graphically (Figure 1). The closeness of PRF was almost of similar order of magnitude as the observed one. This may be due to the fact that this function accounted for rising and declining segments of the lactation curve.
Conclusions
In the present investigation it was found that on an average, the peak yield from all lactation curves functions was found to be highest around 65th day of lactation in Murrah buffaloes. PRF is the best function among four models studied followed by mixed log function explaining highest coefficient of determination with lowest root mean square error and therefore these two functions are recommended for prediction of FTDMYs in Murrah buffaloes.
Acknowledgements
We sincerely thank the Director, National Dairy Research Institute, Karnal and Head, Dairy Cattle Breeding Division for providing necessary facilities for conducting this study. Financial support in form of DST-INSPIRE fellowship (Govt. of India) is duly acknowledged.
Conflict of Interest
The authors declare that there is no conflict of interest.
References


