Advances in Animal and Veterinary Sciences
Research Article
Structural Insight of Bos Indicus ITGB6 Receptor Gene for FMDV Host Tropism
Molecular Genetics Laboratory, Indian Council of Agricultural Research-Central Institute for Research on Cattle, Meerut-250 001, Uttar Pradesh, India; 1 Division of Veterinary Biotechnology, Indian Veterinary Research Institute, Izatnagar, Uttar Pradesh, India; 2Department of Life Science and Bioinformatics, Assam University, Silchar-11, Assam, India.
Abstract | Integrin beta 6 (ITGB6) is a component of FMD virus host tropism receptor in cattle. In the present study, we aimed to identify the structural variation of ITGB6 receptor gene of Bos indicus and their comparative differences with Bos taurus sequence. The study revealed that, in spite of some pivotal differences, the taurine and zebu share all common structural elements of the ITGB6 molecules. Further, study pertaining to SNP (Single nucleotide polymorphism) identification and functional genomics are ongoing to find out the genetic aspect of ITGB6 for conferring host resistant in cattle.
Keywords | ITGB6, FMD, Bos indicus, Bos taurus, Structure, AHI48847, ABH04286
Editor | Kuldeep Dhama, Indian Veterinary Research Institute, Uttar Pradesh, India.
Received | October 18, 2014; Revised | October 19, 2014; Accepted | October 20, 2014; Published | November 05, 2014
*Correspondence | Rajib Deb ,Central Institute for Research on Cattle, Meerut,India; Email: drrajibdeb@gmail.com
Citation | Singh R, Deb R, Singh U, Raja TV, Alex R, Kumar S, Alethodi RR, Sahu J, Datta R, Sengar G, Sharma S (2014). Structural insight of Bos indicus ITGB6 receptor gene for FMDV host tropism. Adv. Anim. Vet. Sci. 2 (10): 549-556.
DOI | http://dx.doi.org/10.14737/journal.aavs/2014/2.10.549.556
ISSN (Online) | >2307-8316; ISSN (Print) | 2309-3331
Copyright >© 2014 Singh et al. This is an open access article distributed under the Creative Commons Attribution License, which permits unrestricted use, distribution, and reproduction in any medium, provided the original work is properly cited.
Introduction
Integrins are one of the important biologically active proteins responsible for FMD virus host interaction. Functional integrins consist of two noncovalently bound transmembrane glycoprotein subunits viz. alpha and beta. Each subunit is composed of a large extracellular domain of a and b residues (120–180 and 90–110 kDa, respectively), a single transmembrane domain and a small, C-terminal cytoplasmic domain (Stewart and Nemerow, 2007). In mammals, the integrin family consists of around 24 different heterodimers, each of which has a distinct tissue distribution.
FMDV has been shown to use four kinds of integrins viz. avb1, avb3, avb6 and avb8 as receptors to initiate infection. Virus attachment to the integrin receptors is mediated by an arginine–glycine–aspartic acid (RGD) tripeptide located on VP1 loop of FMDV. The integrin receptors of FMDV have been investigated extensively in cell culture which have shown that avb6 but not avb3 are expressed constitutively on the epithelial cell surfaces at the site of viral replication to allow initiation of infection (Berinstein et al., 1995; Jackson et al., 2000, 2002, 2004).
In the present study we aimed to analyse the structural prediction of Bos indicus Integrin beta 6 (ITGB6) receptor gene and comparative evaluation with Bos taurus.
Materials and methods
Sequence Information
We have obtained the full length Coding Sequence (CDS) of Bos indicus ITGB6 from GenBank with the accession number AHI48847. The complete CDS of zebu ITGB6 was 2367 base pair in length with 788 amino acid residues. Bos taurus reference sequences included in the analysis was taken from GenBank accession number ABH04286.
Primary and Secondary Structure Analysis
To get into the chemistry of the sequences for structural analysis, the primary structure information of the protein sequences for Accession nos. ABH04286 and AHI48847 was studied using ProtParam tool (http://expasy.org/cgi-bin/protparam) (Gasteiger et al., 2005) at the Expasy Proteomic Server. Various physico-chemical parameters such as molecular weight, isoelectric point, instability index, aliphatic index, and grand average hydropathy (GRAVY) were computed. The CONCORD (Wei et al., 2011) and PSIPRED server (Buchan et al., 2010) were used for the prediction of secondary structure information of the protein.
Model Construction and Optimization
Model construction using appropriate computational tools has become very common practice due to their efficiency in reliable theoretical 3-D model of protein from its primary amino acid sequence. For identification of suitable templates, DELTA-BLAST (domain enhanced lookup time accelerated BLAST) against PDB was performed. DELTA-BLAST was preferred against normal BLASTP because the retrieval accuracy and sensitivity towards protein analysis is more in case of DELTA-BLAST than normal BLASTP. Discovery Studio version 3.5 (DS3.5; Accelrys Inc. San Diego, CA, USA) was used to carry out the homology modelling. DS3.5 provided 10 different models, ranked according to their discrete optimized protein energy (DOPE) score (a statistical potential to assess the quality of the models). The model with lowest DOPE score was selected as the best model. The quality of the model for Acc oxidase in Tinospora was evaluated by a number of tools to test the internal consistency and reliability of the model. The Structural Analysis and Verification Server (SAVeS) (http://nihserver.mbi.ucla.edu/SAVES/) was used which is a metaserver which incorporates PROCHECK (Laskowski et al., 1996), ERRAT (Colovos et al., 1993), VERFIY3D (Eisenberg et al., 1997) and PROVE (Pontius et al., 1996) programs for model validation. PROCEHCK analysis, which quantifies the residues in available zones of Ramachandran plot, was used to assess the stereo-chemical quality of the model.
MD Simulation
GROMACS 4.6 (Groningen Machine for Chemical Simulations) (Van et al., 2005) package was used to run MD simulations to assess the structural integrity of the model. To investigate the stability and dynamics of the modelled protein, we considered the GROMOS96 43A1 force field and the flexible TIP3P water model (Walter et al., 1999). A high performance CentOS6.0 cluster computer was used for running the MD simulation. The model was surrounded by a periodic box that extends 11 Å from the protein atoms. The protonation states of all the ionisable amino acids were determined at pH 7.0. To neutralize the system, sodium counter ions were added replacing random water molecules. The Energy minimization was performed using steepest descent algorithm for 10,000 steps. A 1-ns position restrained and a 10-ns production MD simulation was performed for each simulation system at constant pressure (1 bar) and temperature (300 K). Covalent bonds in the enzymes and water molecules were constrained using the SHAKE and SETTLE algorithms, respectively. A twin cut-off scheme of 9 Å was implemented for treating long-range and van der Waals interactions. Electrostatic interactions were computed using the particle mesh Ewald (PME) method. The time step for MD simulation was 2 fs and the snapshots were saved every 1 ps. The analysis was performed using visual molecular dynamics Grace 5 (http://plasma-gate.weiz-mann.ac.il/Grace/) programs. All computations were conducted with a high performance computer cluster.
Results and discussion
Primary and Secondary Structure Analysis
The primary sequence information was obtained using the ProtParam tool. The lengths of both the amino acid sequences were 788 (Table 1). The molecular weight for ABH04286 and AHI48847 were 85954.9 and 85832.8. Primary sequence information also provided the theoretical pI which was 5.08 and 5.05 for ABH04286 and AHI48847 respectively. The instability index and aliphatic index were calculated to be 43.50 and 81.37 for ABH04286 whereas for AHI48847 they were 43.72 and 81.87 respectively. The tool also calculated the grand average hydropathy i.e. GRAVY which was -0.168 for ABH04286 and -0.170 for AHI48847. To insight into the secondary sequence information, 2 servers were used; CONCORD and PSIPRED (Table 2). For ABH04286, the percentage of coils, helix and sheet were found 65.2%, 17.2% and 17.6% in case of PSIPRED results whereas in CONCORD, the same were found with 63.7%, 17.9% and 18.4%. In case of AHI48847 the PSIPRED and CONCORD detected the percentage of coils, helix and sheet as 66.1%, 15.7%, 18.2% and 64.2%, 17.5%, 18.3% respectively.
Table 1: The primary structure information i.e. the summary of Prot Param results
|
Sequence |
Number of amino acids |
Molecular weight |
pI |
Instability index |
GRAVY |
Aliphatic index |
|
ABH04286 |
788 |
85954.9 |
5.08 |
43.50 |
-0.168 |
81.37 |
|
AHI48847 |
788 |
85832.8 |
5.05 |
43.72 |
-0.170 |
81.87 |
Table 2: The secondary structure information i.e. the summary of PSIPRED and CONCORD
|
Sequence |
No of Coil |
Percentage of Coil |
No of Helix |
Percentage of Helix |
No of Sheet |
Percentage of Sheet |
Total |
|
PSIPRED |
|||||||
|
ABH04286 |
514 |
65.2 |
135 |
17.2 |
139 |
17.6 |
788 |
|
AHI48847 |
521 |
66.1 |
124 |
15.7 |
143 |
18.2 |
788 |
|
CONCORD |
|||||||
|
ABH04286 |
502 |
63.7 |
141 |
17.9 |
145 |
18.4 |
788 |
|
AHI48847 |
506 |
64.2 |
138 |
17.5 |
144 |
18.3 |
788 |
Table 3: The significant BLAST matches to PDB proteins for the two protein sequences with accession numbers ABH04286 and AHI48847
|
PDB ID |
Description |
Query coverage (%) |
Identity (%) |
E value |
|
3IJE |
Chain B, Crystal Structure Of The Complete Integrin Alhavbeta3 Ectodomain Plus An Alpha/beta Transmembrane Fragment |
87% |
50% |
0 |
|
4G1M |
Chain B, Re-Refinement Of Alpha V Beta 3 Structure |
86% |
50% |
0 |
|
4G1E |
Chain B, Crystal Structure Of Integrin Alpha V Beta 3 With Coil-Coiled Tag |
86% |
50% |
0 |
|
1JV2 |
Chain B, Crystal Structure Of The Extracellular Segment Of Integrin Alphavbeta3 |
86% |
50% |
0 |
|
3FCS |
Chain B, Structure Of Complete Ectodomain Of Integrin Aiibb3 |
86% |
50% |
0 |
Table 4: SAVEs server analysis summary of the predicted model
|
Model validation server |
Parameters |
ABH04286 |
AHI48847 |
|
Procheck |
Most favored regions (%) |
87.4% |
87.3% |
|
Additionally allowed regions (%) |
11.3% |
11.1% |
|
|
Generously allowed regions (%) |
1.3% |
1.0% |
|
|
Disallowed regions (%) |
0% |
0.6% |
|
|
Overall G-factor |
-0.11 |
-0.11 |
|
|
Verfiy-3D |
Averaged 3D-1D Score > 0.2 |
81.99% |
fail |
|
ERRAT |
Overall Quality (%) |
66.902 |
fail |
|
PROVE |
Prove RMS Z-score |
21.616 |
30.614 |
Model Construction and Optimization
The two protein sequences were searched against PDB database and significant matches with protein sequences having 3D structure. BLAST matches for the two Accessions i.e. ABH04286 and AHI48847 were the same as these two sequences are having 3 nucleotide mismatches in between them. The matches having more than 80% query coverage were taken into account for the homology modelling. A total of 5 PDB IDs were found to have significant matches (Table 3). The PDB ID 3IJE which represents Chain B, crystal structure of the complete Integrin Alhavbeta3 Ectodomain plus an alpha/beta transmembrane fragment was found to have maximum query coverage of 87% with an identity of 50% and e-value of 0. All the 5 PDB IDs in table 4 were used as template for both of the protein sequence in homology modelling. Model building was performed after aligning the structure and sequence. DS3.5 constructed two models for the ABH04286 and AHI48847 sequences which were very homologues due to their sequence similarity as well as having the same templates.
ABH04286 Model
The 3D structure of the predicted model has been shown in the Figure 1-a. The model was submitted to SAVeS server for the model validation. The Procheck server provided the Ramachandran plot which presented the amino acid positions (Figure 2-a). The plot found 87.4% residues in the favourable region along with 11.3% residues in the additionally allowed and 1.3% in generously allowed regions. There was 0 residues present in the disallowed region. The overall G-factor was -0.11. The Verfiy-3D server predicted 81.99% for the averaged 3D-1D Score > 0.2. The ERRAT and PROVE servers predicted the overall quality as 66.902 and Prove RMS Z-score to be 21.616respectively (Table 4).
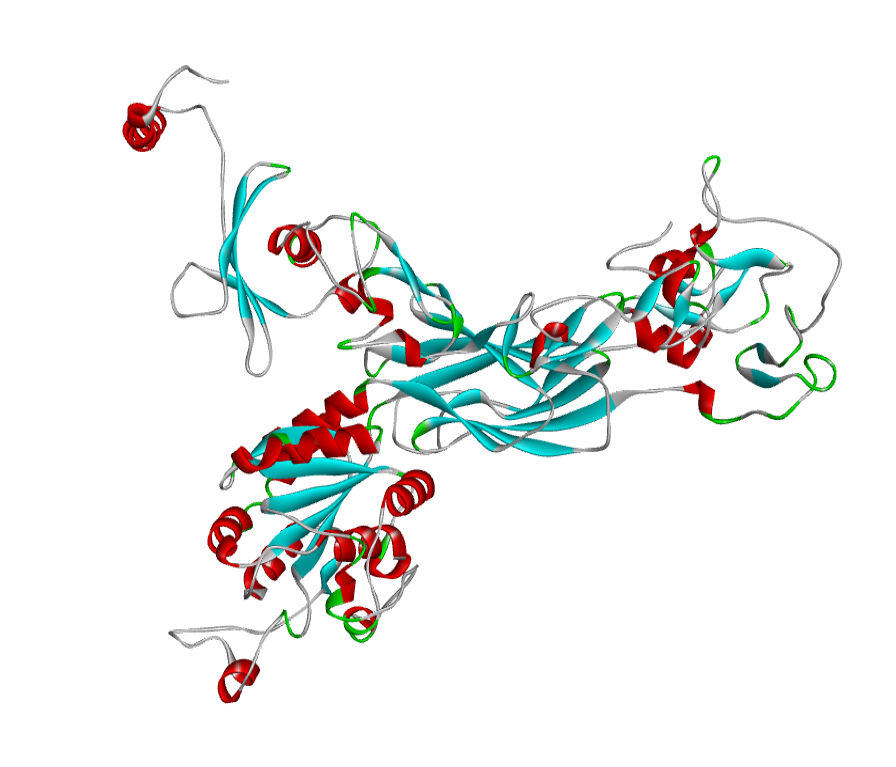
The 3D structure of the predicted model has been shown here. The model was submitted to SAVeS server for the model validation.
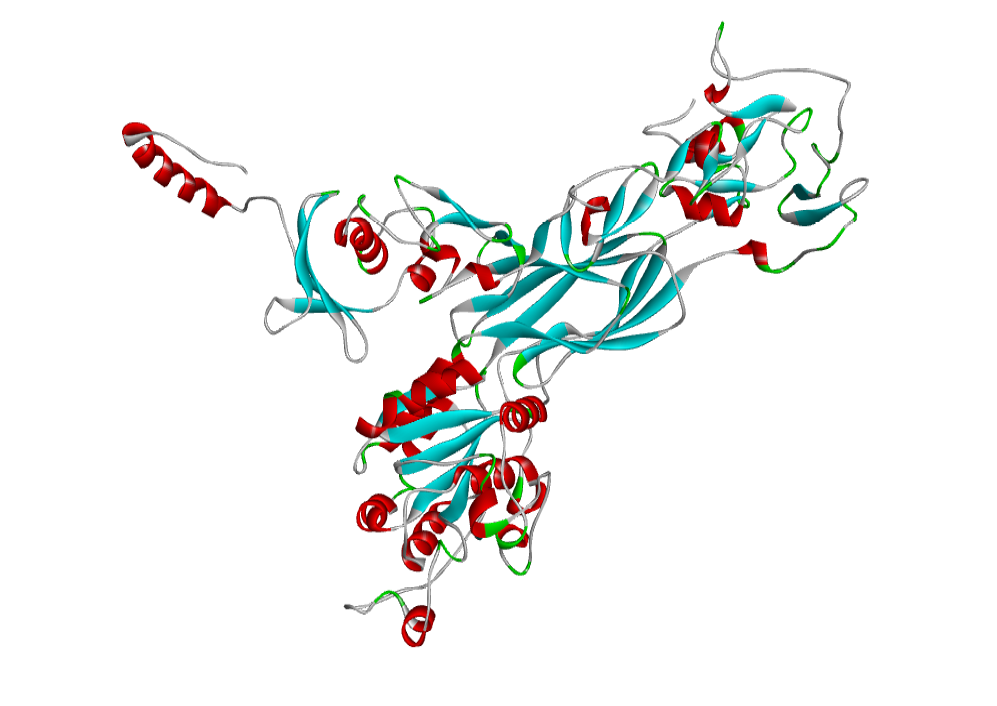
AHI48847 Model
The 3D structure of the predicted model has been shown in the Figure 1-b. The Procheck server in the SAVeS server provided the Ramachandran plot which presented the amino acid positions (Figure 2-b). The plot found 87.3% residues in the favourable region along with 11.1% residues in the additionally allowed and 1% in generously allowed regions. There was 0.6% residues present in the disallowed region. The overall G-factor was -0.11 same as ABH04286.
The Verfiy-3D server and ERRAT failed to predict the averaged 3D-1D Score > 0.2 and the overall quality. The PROVE server predicted the Prove RMS Z-score to be 30.614 (Table 4).
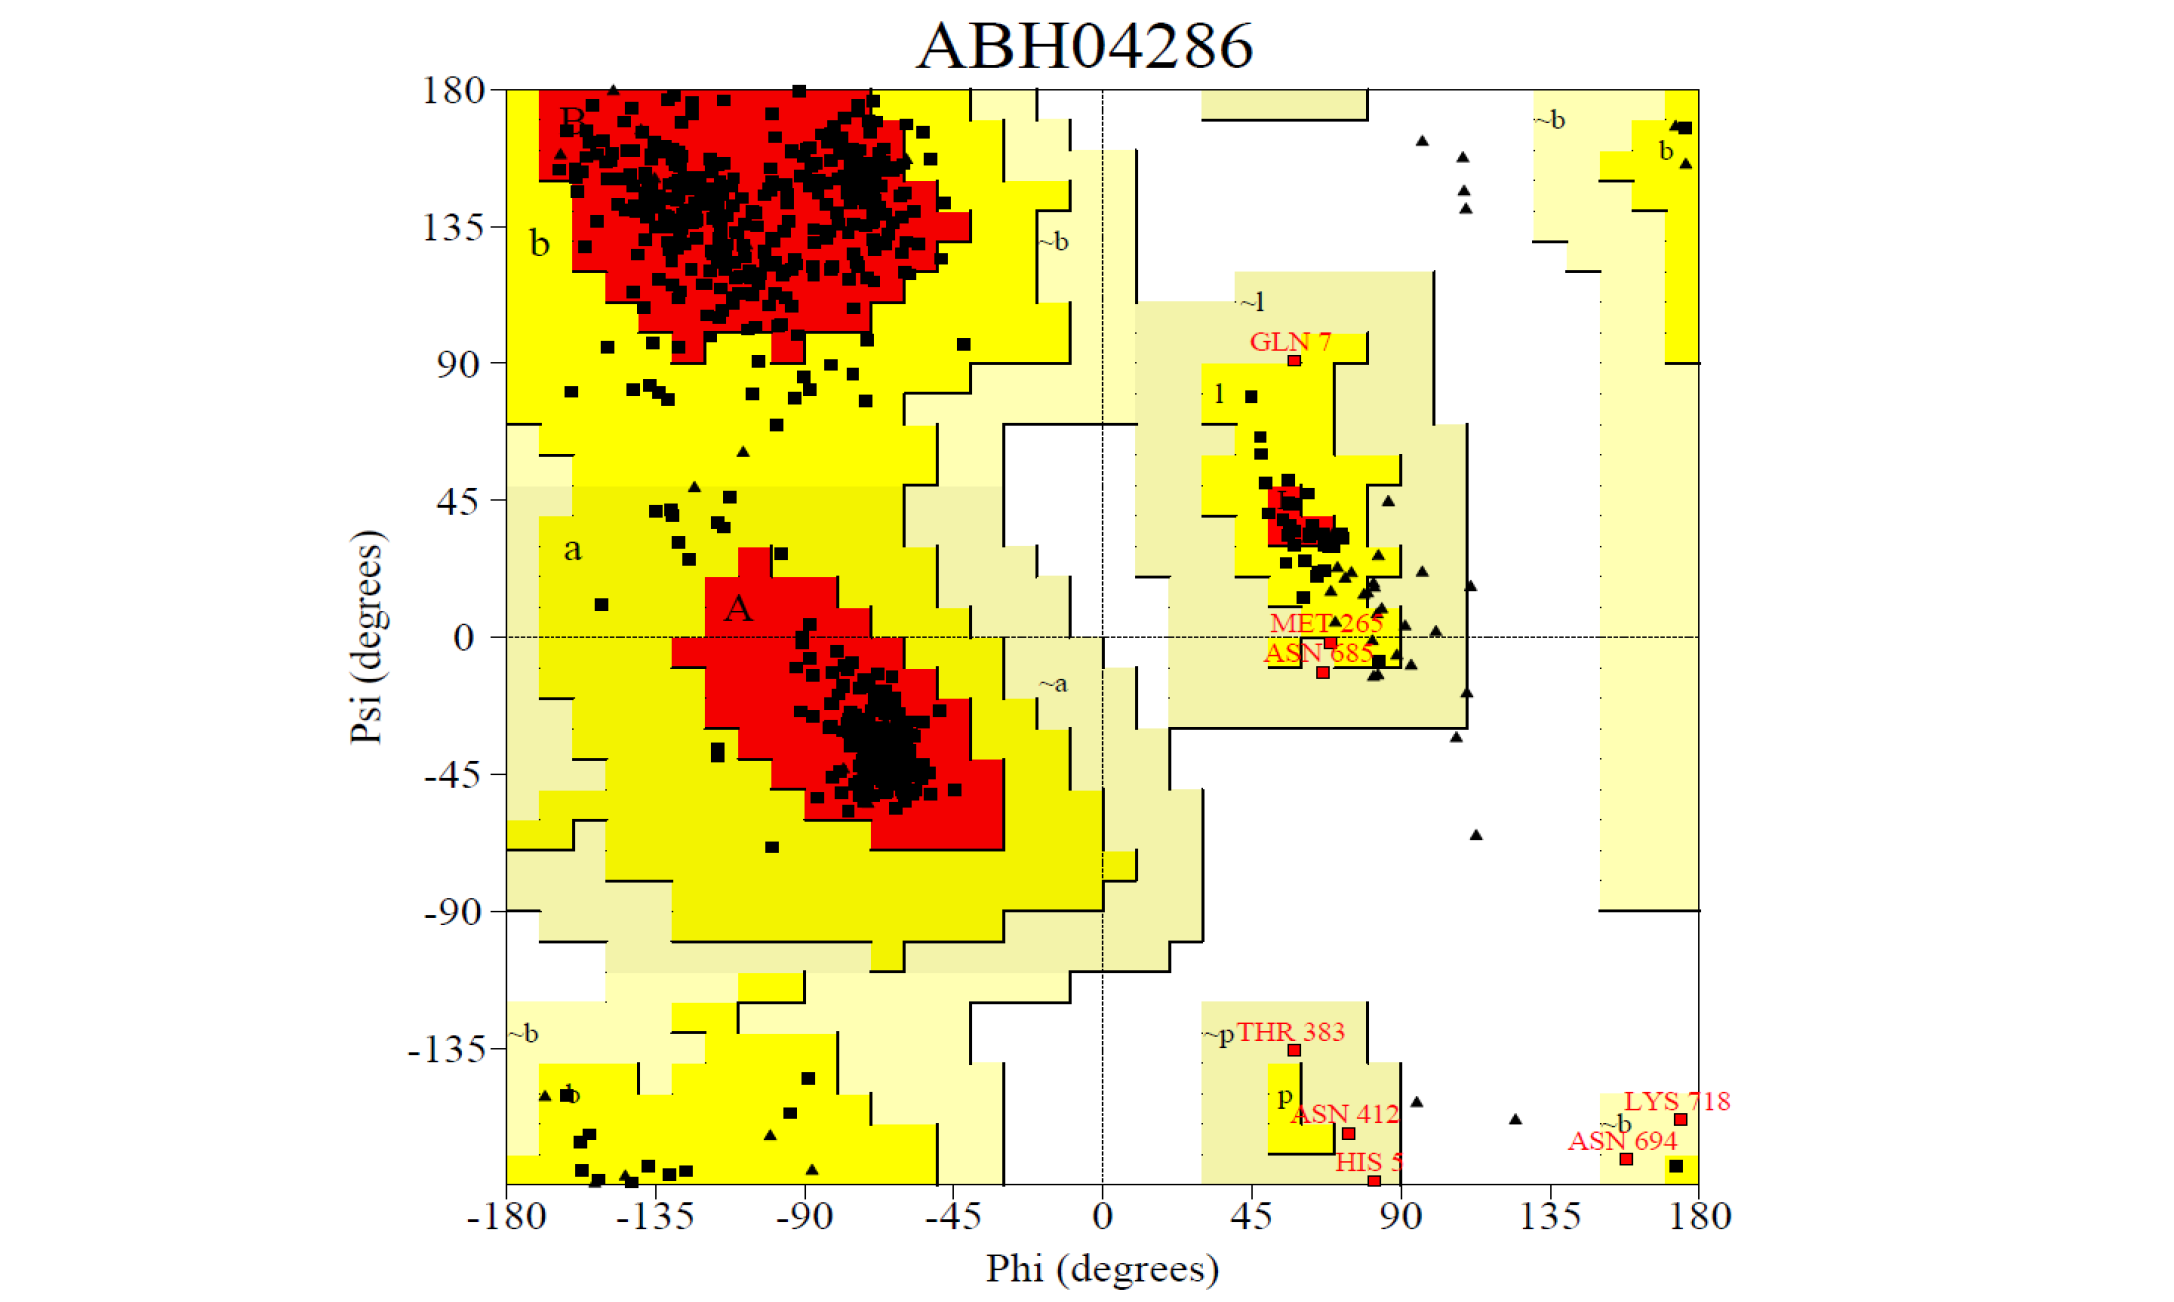
The Procheck server provided the Ramachandran plot which presented the amino acid positions shown in the figure.

Figure 3a: Root Mean Square Deviation (RMSD), Root Mean Square fluctuation (RMSf), Radius of gyration, Potential energies and Total energies plots for the modelled protein throughout the MD simulation a) ABH04286
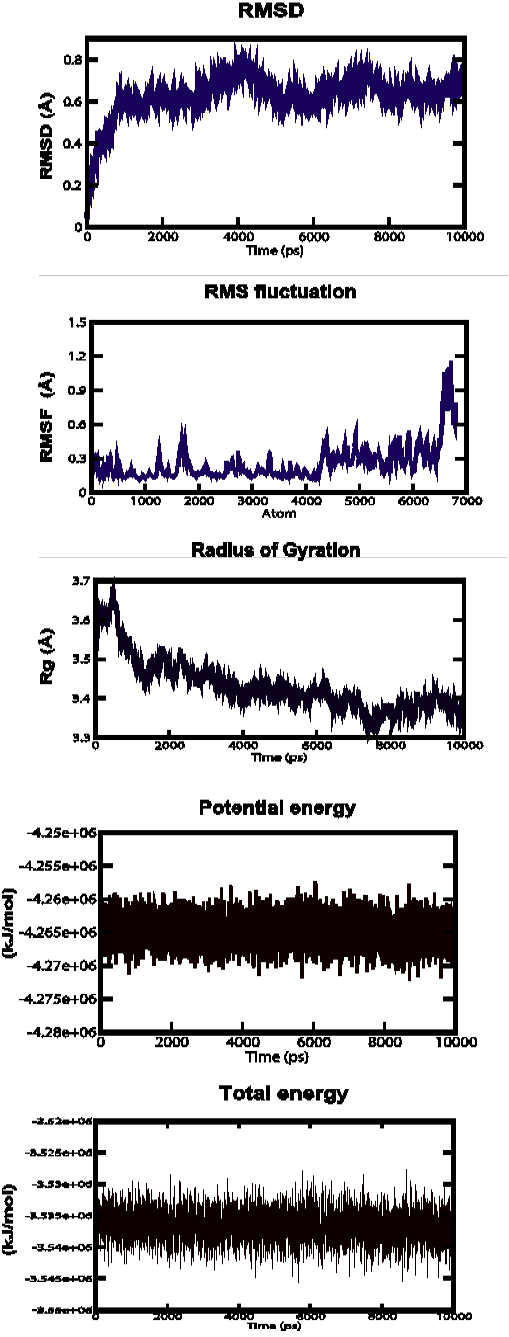
Figure 3b: Root Mean Square Deviation (RMSD), Root Mean Square fluctuation (RMSf), Radius of gyration, Potential energies and Total energies plots for the modelled protein throughout the MD simulation b) AHI48847
MD Simulation
ABH04286 Model
MD simulations were performed to study the dynamic behaviour of the predicted model at 10 ns. The Root Mean Square Deviation (RMSD) graph provided the information regarding the change in structure from the original one throughout the course of simulation. The change observed in this case varied from 0.18 A to 1 A with an average of approximately 0.6 A (Figure 3-a). The Root Mean Square Fluctuation (RMSF) graph represented the fluctuation of each atom among all the atoms. The graph showed a minimum at approximately 0 A to an upper limit of 1.7 A at the end. The gyration plot in which the radius of gyration (RG) was plotted in the Y-axis and time interval in the X-axis showed an average value of approximately 3.6 A, the RG value ranged from around 0 A to 3.9 A. The potential and total energy changes throughout the simulation process were represented in the plot. The average potential energy was approximately - 5325000 KJ/mol whereas in case of total energy, it was - 4415000 KJ/mol. The Radius of gyration plot measured the compactness of the structure and the mass of the atom relative to the centre of mass of the molecule.
AHI48847 Model
MD simulations were performed to study the dynamic behaviour of the predicted model at 10 ns. The Root Mean Square Deviation (RMSD) graph provided the information regarding the change in structure from the original one throughout the course of simulation. The change observed in this case varied from 0 A to 0.19 A with an average of approximately 0.6 A (Figure 3-b). The Root Mean Square Fluctuation (RMSF) graph represented the fluctuation of each atom among all the atoms. The graph showed a minimum at approximately 0.1 A to an upper limit of 1.2 A, but at the end atom, the value was 0.5 A. The gyration plot in which the radius of gyration (RG) was plotted in the Y-axis and time interval in the X-axis showed an average value of approximately 3.5 A, the RG value ranged from around 0 A to 3.7 A. The potential and total energy changes throughout the simulation process were represented in the plot. The average potential energy was approximately - 4265000 KJ/mol whereas in case of total energy, it was - 3535000 KJ/mol. The Radius of gyration plot measured the compactness of the structure and the mass of the atom relative to the centre of mass of the molecule.
From the structural performance of ITGB6, it revealed that, despite some focal differences, the taurine and zebu cattle share all common elements of the ITGB6 molecules. Genetic makeup responsible for conferring naturally acquired FMDV resistance among zebu cattle is quite interesting and need to be initiated. At present, we are trying to identify SNPs within ITGB6 receptor gene and their association with FMDV susceptibility in cattle. Further, study on the identification of transcript variants among Zebu ITGB6 receptor gene also need to be initiated.
Acknowledgement
The project (SR/WOS-A/LS-437/2012 -G) was financially supported by Department of Science and Technology, Govt. of India. The authors are thankful to Director, ICAR-CIRC, Meerut, for providing necessary facilities for conducting the study.
References


