Advances in Animal and Veterinary Sciences
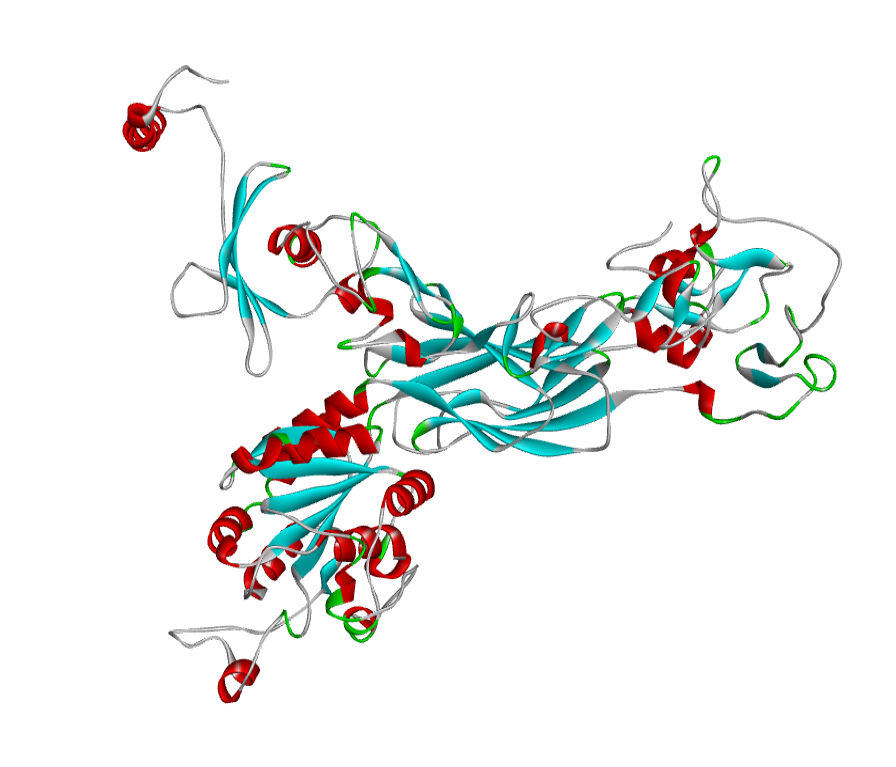
The predicted model through homology modelling using Discovery Studio 3.5. a) ABH04286
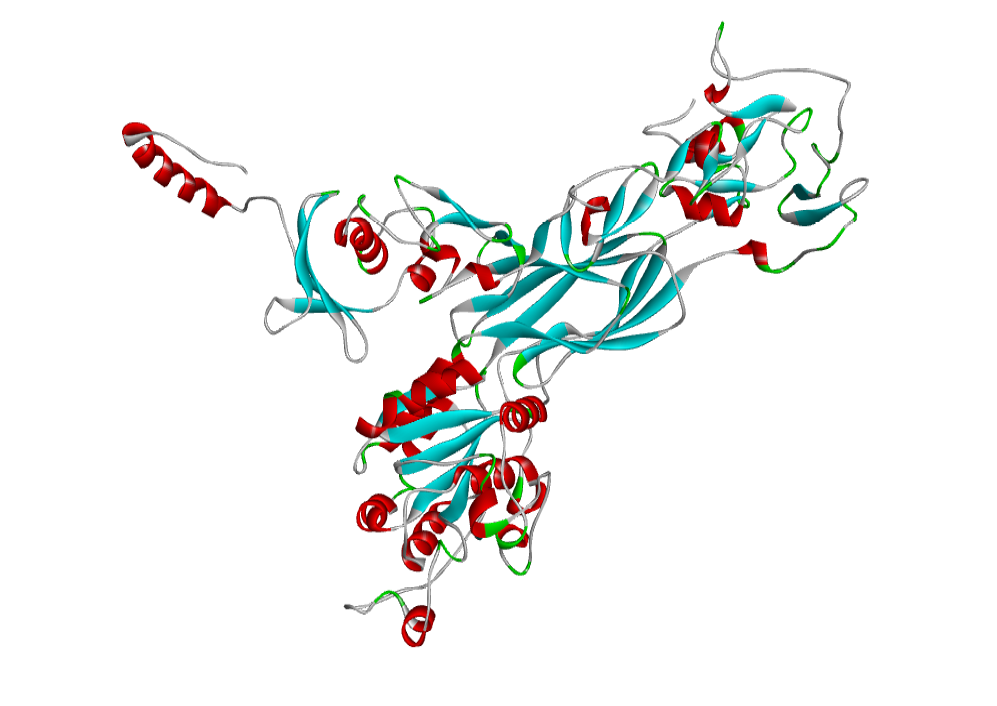
The predicted model through homology modelling using Discovery Studio 3.5. b) AHI48847. The 3D structure of the predicted model has been shown here. The model was submitted to SAVeS server for the model validation.
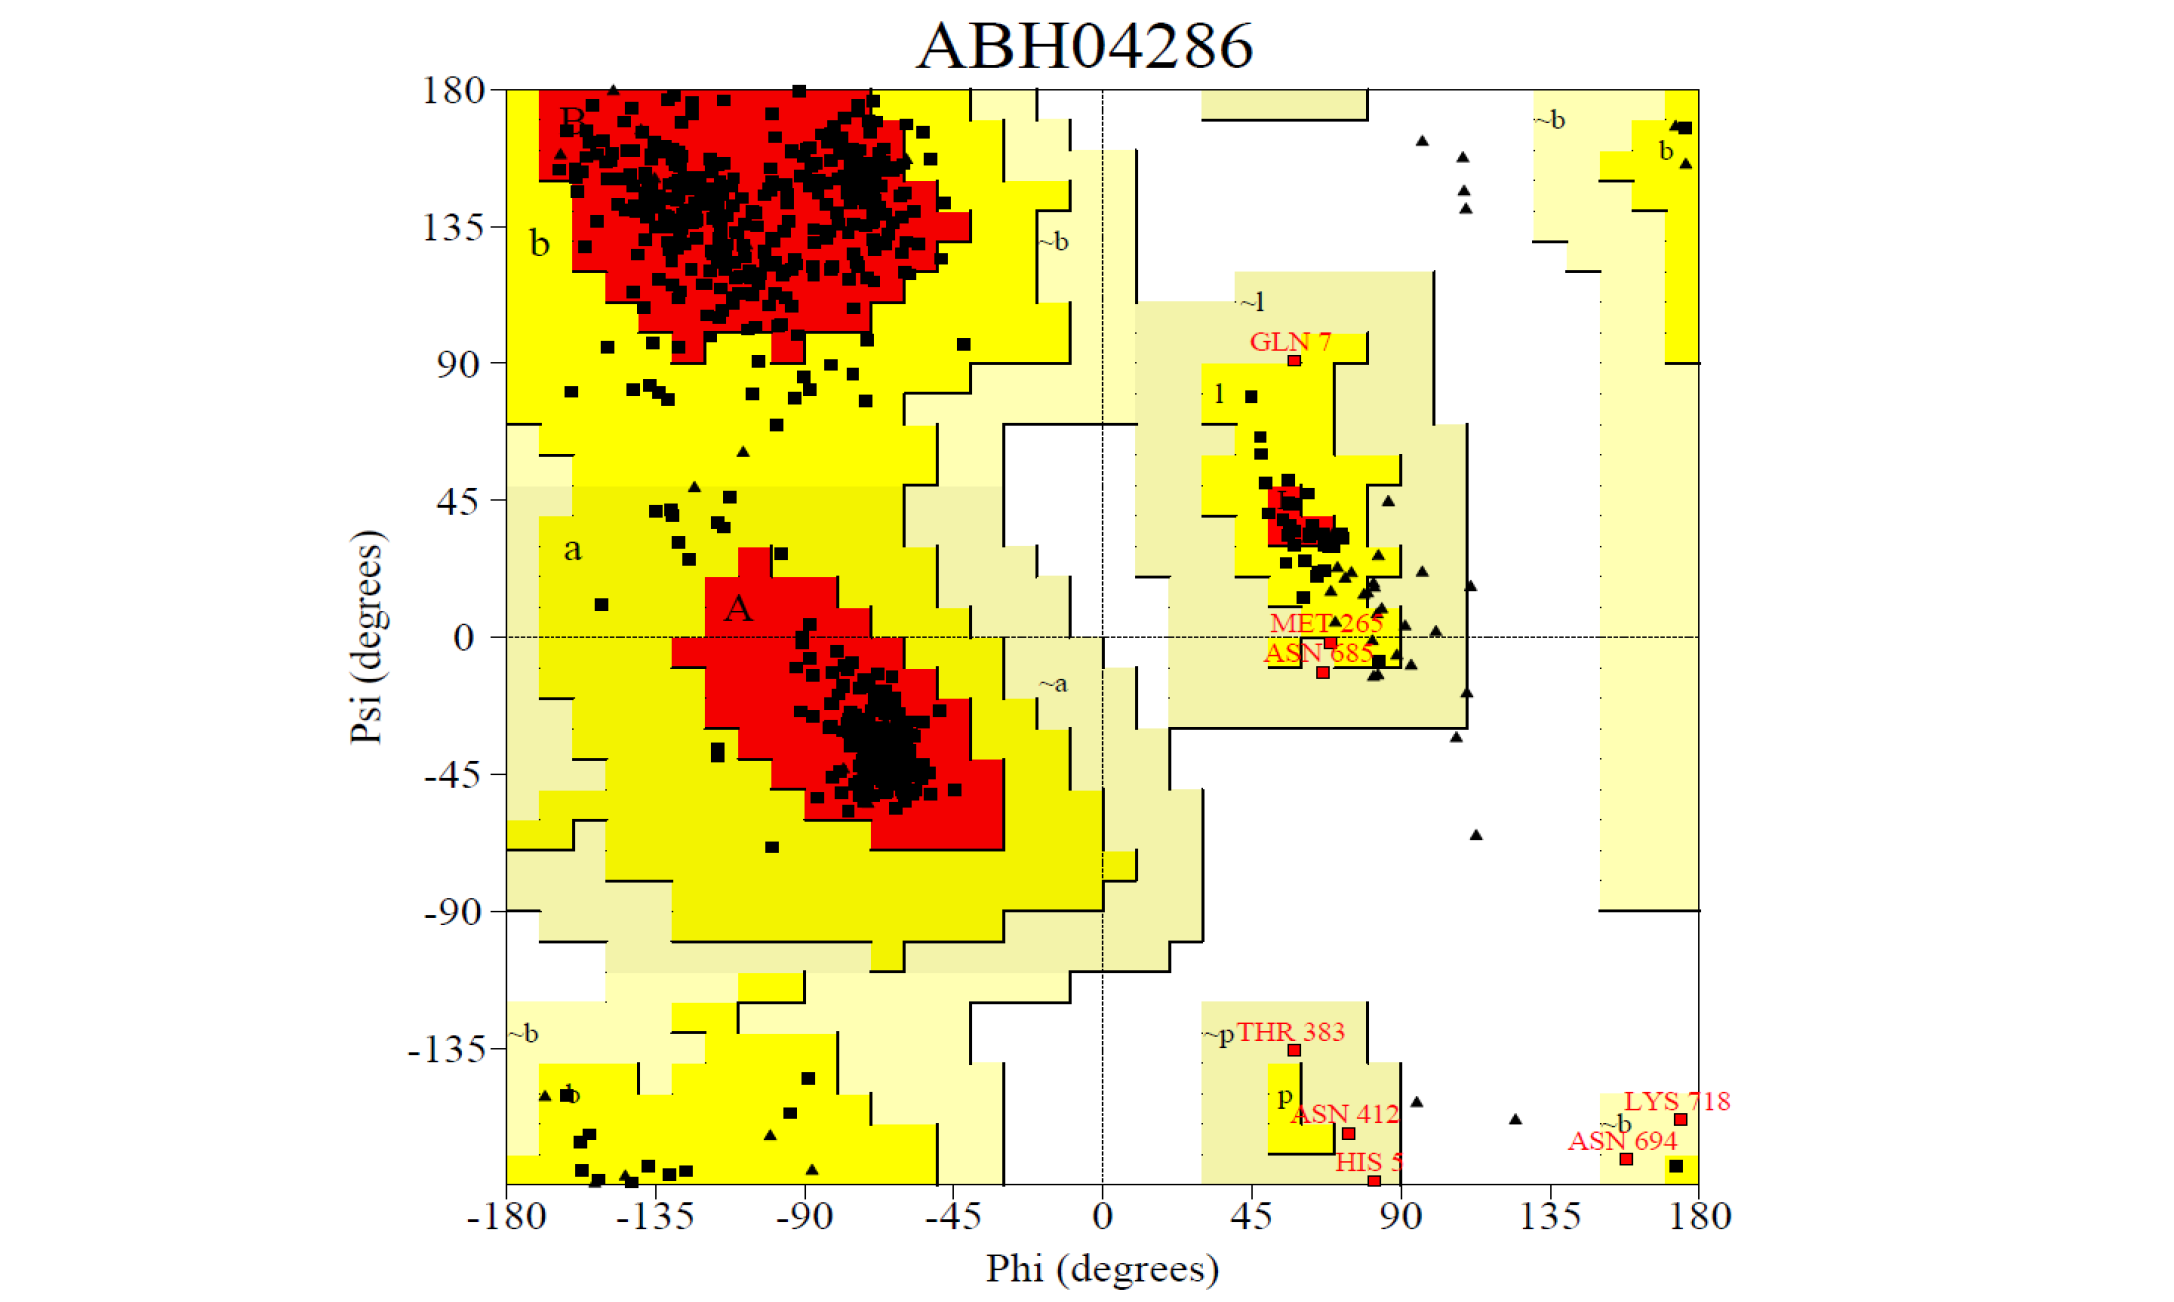
Ramachandran plot for the predicted model from the SAVEs server a) ABH04286
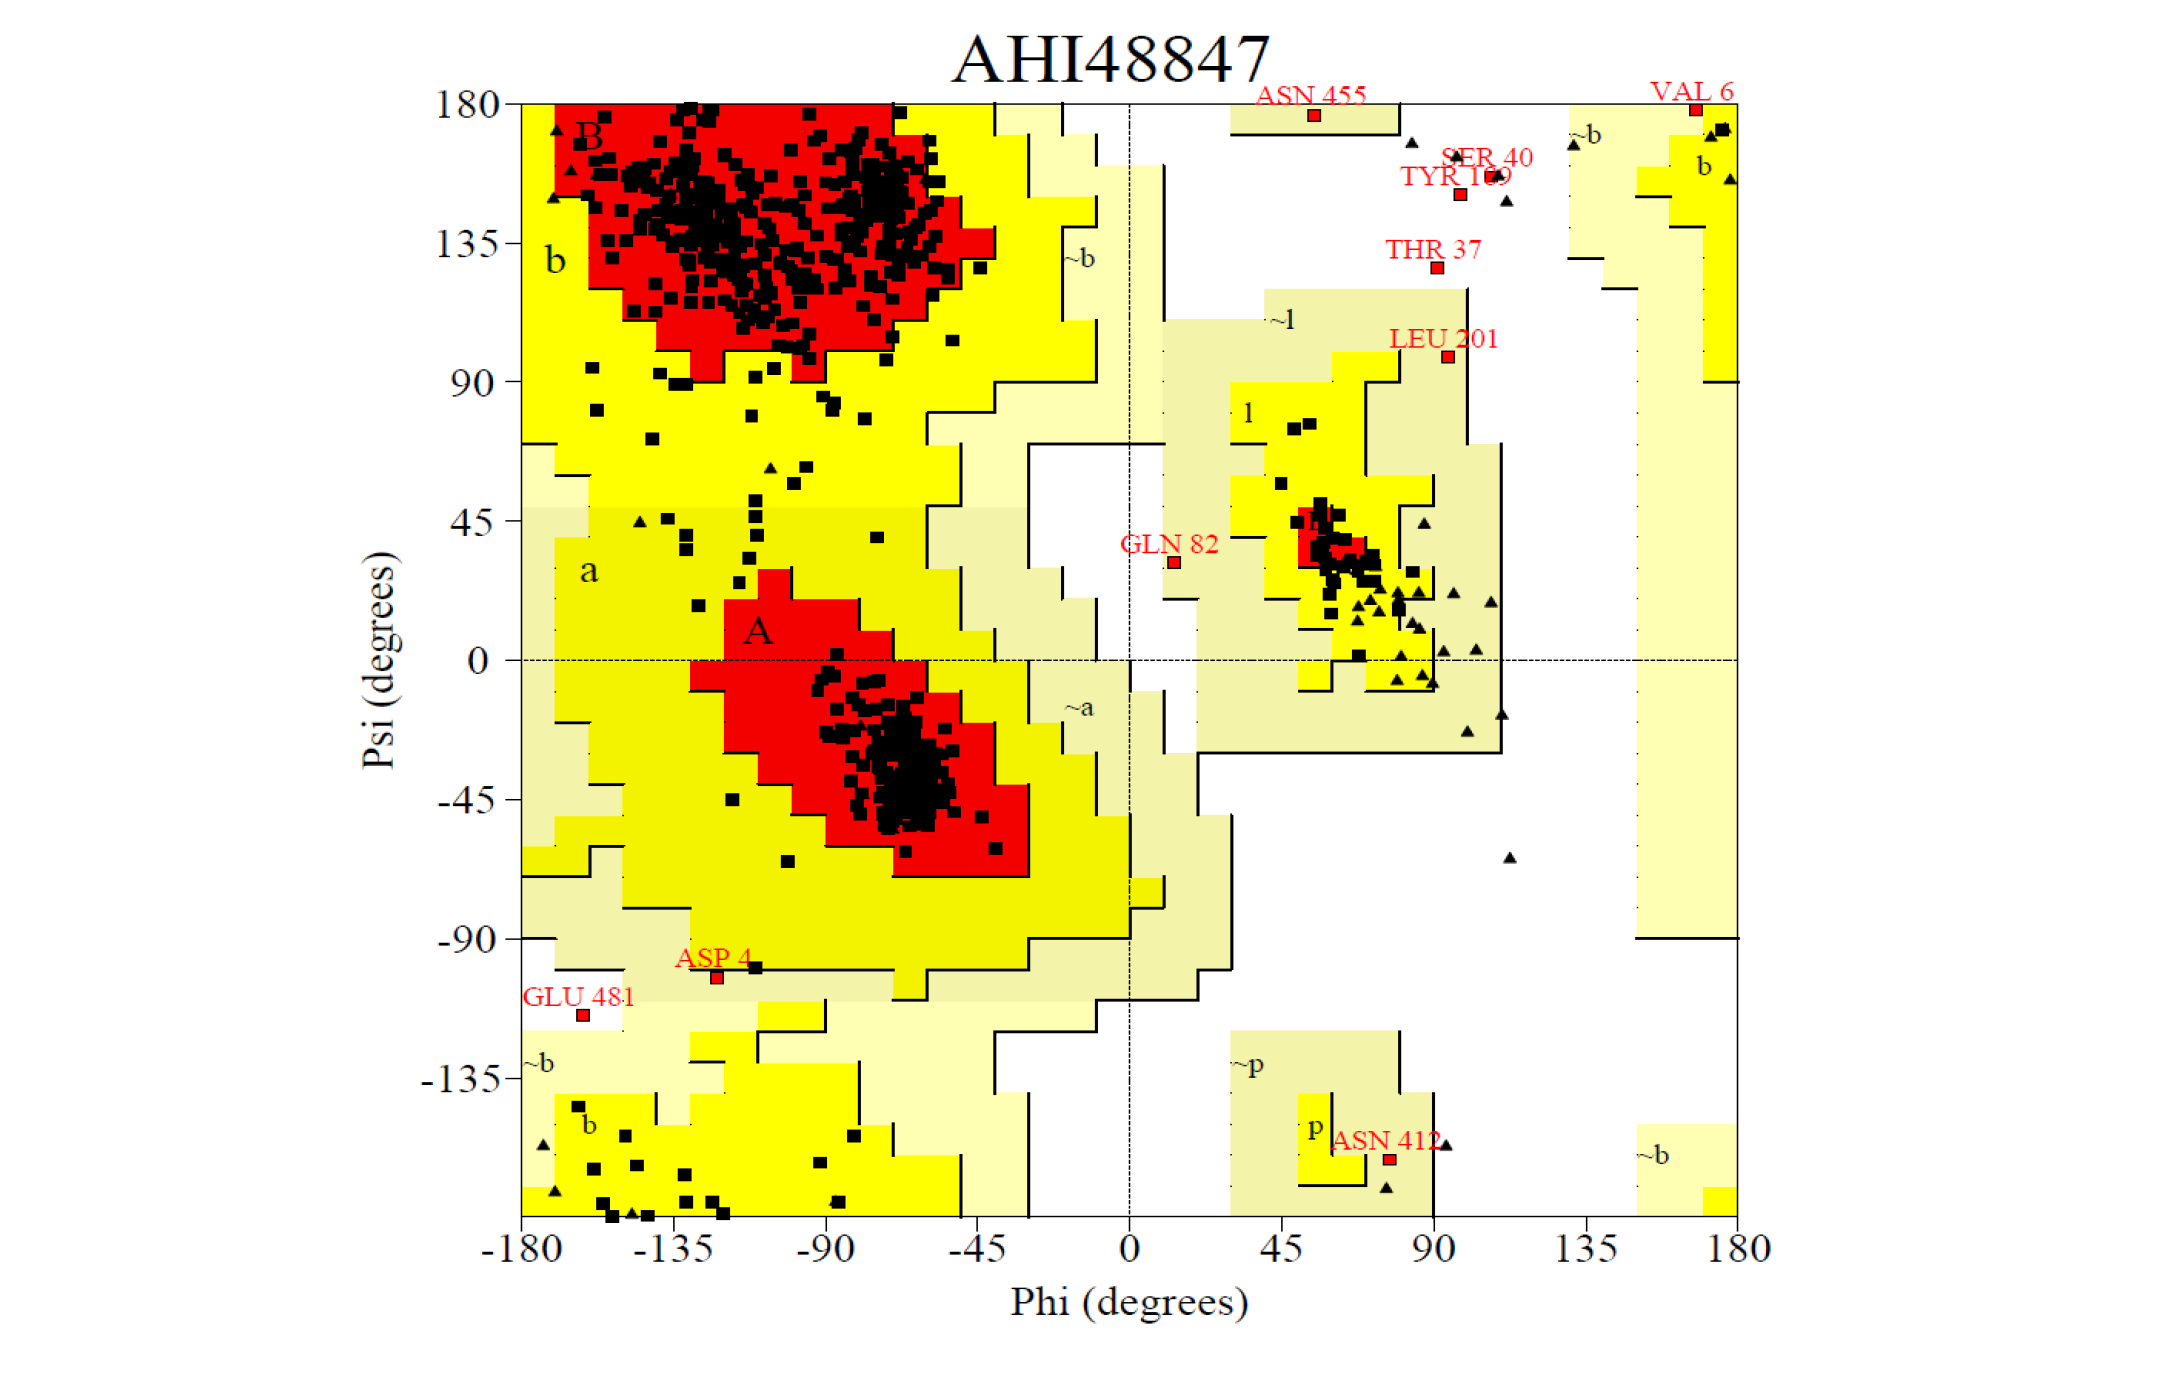
Ramachandran plot for the predicted model from the SAVEs server b) AHI48847. The Procheck server provided the Ramachandran plot which presented the amino acid positions shown in the figure.

Root Mean Square Deviation (RMSD), Root Mean Square fluctuation (RMSf), Radius of gyration, Potential energies and Total energies plots for the modelled protein throughout the MD simulation a) ABH04286.
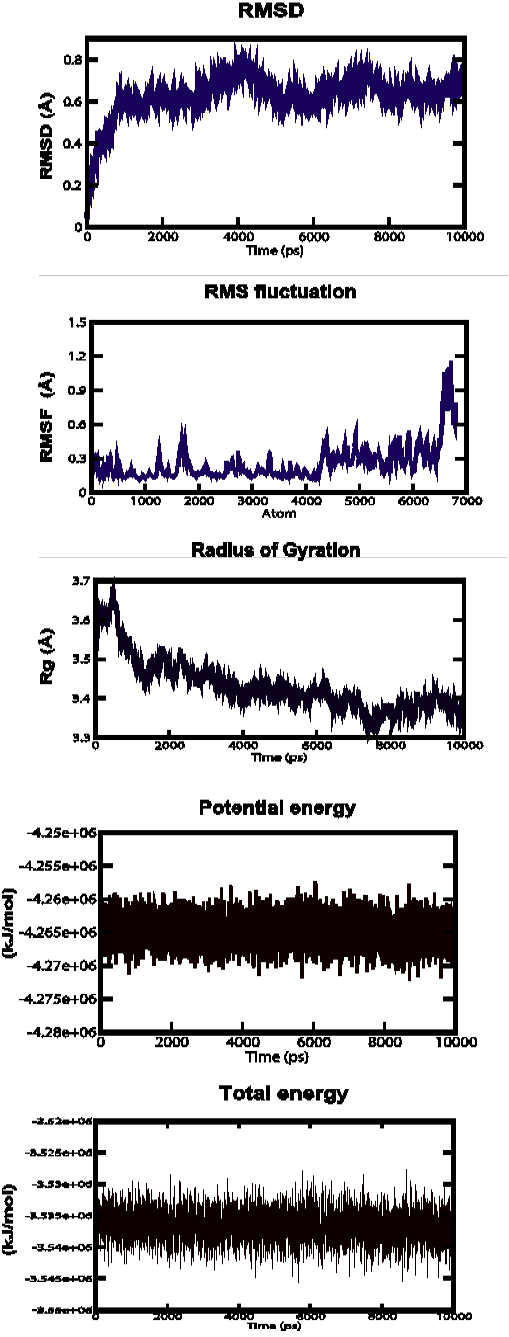
Root Mean Square Deviation (RMSD), Root Mean Square fluctuation (RMSf), Radius of gyration, Potential energies and Total energies plots for the modelled protein throughout the MD simulation b) AHI48847.


