Advances in Animal and Veterinary Sciences
Research Article
Advances in Animal and Veterinary Sciences 2 (6): 337 – 343Effect of Increasing Dietary Protein from Soybean Meal on Intestinal Microbiota and Their Fatty Acids Production in Broiler Chicken
Massalin Nakphaichit1, Chirapiphat Phraephaisarn2, Suttipun Keawsompong1, Orapin Sukpiriyagul3, Sunee Nitisinprasert1, 4 *
- Department of Biotechnology, Faculty of Agro–Industry, Kasetsart University, 50 Ngam Wong Wan Rd., Chatuchak, Bangkok 10900, Thailand
- Betagro Science Center Co., LTD., Thailand Science Park, 136 Moo 9, Klong Nueng, Klong Luang, Pathum Thani 12120, Thailand
- Betagro Agro–Group Public Co. Ltd., 46 Petchaheung Road, Prapadaeng, Samut Prokan 10130, Thailand
- Center of Excellence on Agricultural Biotechnology: (AG–BIO/PerDO–CHE), Bangkok 10900, Thailand
*Corresponding author: fagisnn@ku.ac.th
ARTICLE CITATION:
Nakphaichit M, Phraephaisarn C, Keawsompong S, Sukpiriyagul O, Nitisinprasert S (2014). Effect of increasing dietary protein from soybean meal on intestinal microbiota and their fatty acids production in broiler chicken. Adv. Anim. Vet. Sci. 2 (6): 337 – 343.
Received: 2014–06–20, Revised: 2014–07–10, Accepted: 2014–07–11
The electronic version of this article is the complete one and can be found online at
(
http://dx.doi.org/10.14737/journal.aavs/2014/2.6.337.343
)
which permits unrestricted use, distribution, and reproduction in any medium, provided the original work is properly cited
ABSTRACT
To evaluate the effect of increasing dietary protein from soybean meal on chicken growth, three treatments of the control (22% CP), additional crude protein diet (28% CP) and additional essential amino acid diet (22% CP with high dose of EAA) were fed for 900 broiler chickens with an age average of 1–21 days. Twenty birds per treatment were randomly sampling for the effects on intestinal villi, gut microbiota and short chain fatty acid production. Results indicated high protein diet had no effect on chicken growth, however, it decreased the villi height and Lactobacilli in jejunum of chicken. Interestingly, the enrichment of CP and EAA supplemented diet promoted especially Clostridium coccoides–Eubacterium rectal group for two times of the control in the ileum of chicken. While the suppression of Campylobacter in cecum and undetectable Clostridium perfringens were observed. There were no significant different for microbial short chain fatty acid production in intestine. The concentrations of lactic acid, propionic acid and acetic acid detected from the control and these two treatments were not significantly different. On the basis of these findings, high protein diet from soybean meal affected broiler gut microbiota especially the increasing of Clostridium coccoides–Eubacterium rectal group, but did not support their growth performance and intestinal metabolites.
INTRODUCTION
Crude protein (CP) is a main component for metabolism and has great impact on broiler chicken performance (Malheiros et al., 2003). These amino acids are absorbed and metabolized to body proteins. Most of experiments tried to optimize crude protein and Essential Amino Acid (EAA) concentration for increasing the growth efficiency of broiler chicken which were analyzed in the term of growth rate, body weight gain and feed consumption (Rezaei et al., 2004; Kobayashi et al., 2013). However, these performance data were not enough to determine the effects of crude protein and their concentration on chicken health problem and diseases. Intestinal bacterial community had an enormous impacts on the nutritional and health status of the host. The intestinal microbiota play a major roles on feed digestion, nutrient absorption and pathogenic growth inhibition which directly effect on the health of host (Gong et al., 2007). An important factor influencing on stability of intestinal microorganism is feed composition (Shakouri et al., 2009; Palliyeguru et al., 2010). Dahiya et al., (2005) found that high–protein diet particularly from fish meal contributed incidence of necrotic enteritis (NE) by Clostriduim perfringens and also decreased the number of beneficial bacteria of genus Lactobacillus in broiler chicken. The great amount of wheat, barley and rye increase intestinal viscosity and influence gut microflora by increasing amount of C. perfringens in chicken (Jia et al., 2009). While the prebiotic oligosaccharide supplement in feed could promote the growth of bifidobacteria and lactobacilli which are classified as beneficial bacteria (Kim et al., 2011). Hence both advantage and non–advantage to gut microorganism can be gained due to the composition of feed.
Two sources of CP used in poultry feed are from animal and crop (Drew et al., 2004). Currently meat meal is not allowed to use in Europe because the problem of Bovine Spongiform Encephalopathy (BSE) contamination had occurred (Leeson and Summers, 2009). Therefore, the protein from crop especially soybean meal is frequently used as crude protein in poultry feed formulations (Palliyeguru et al., 2010). Moreover amino acid of lysine, methionine, threonine and tryptophan are likely added more frequently as supplement source in poultry industry to enhance poultry growth and its reproductive performance (Laudadio et al., 2012). Nevertheless, there is still a lack of report linking the effect of CP from soybean meal and EAA on intestinal microbiota in broiler chicken.
In this study, the authors aimed to demonstrate the effect of additional concentration of crude protein and EAA on poultry production and health by determining the broiler performance, gut microflora and their metabolites.
MATERIALS AND METHODS
Animal, Diet and Feeding Program
Nine hundred 1–day–old male broiler chicken (Ross, Betagro Agro–Group Public Co. Ltd.) were randomly distributed into 30 floor pen of 30 broilers so that ten replicates were available for each of the two treatments (high CP and EAA supplemented groups) and the control group. The commercial soybean meal based diets used in this experiment were suggested by the National Research Council (1994). From 1 to 21 day of age, the chicken of control, high CP and EAA supplemented group were fed with crude protein of 22%, 28% and 22%, respectively. While the diet formula of EAA supplemented group was modified from control by adding methionine, lysine and threonine to final concentration similar to high CP supplemented group as shown in Table 1. All birds had access to feed and water ad libitum.
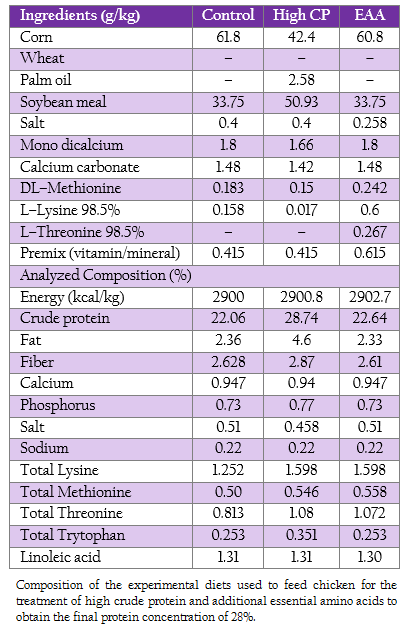
Table 1: : Composition of the experimental diets used to feed chicken for the treatment of high crude protein and additional essential amino acids to obtain the final protein concentration of 28%.
Intestinal Sample Collection
Two birds were randomly selected from each of the 10 pens per treatment (20 birds per treatment) at 21 days post hatch. Jejunum, ileum and cecum of the bird killed by carbon dioxide asphyxiation were collected. The tissues were steriled by 70% ethanol, washed twice by sterile water and then kept at –20C until use.
Genomic DNA Extraction
DNA was extracted from 1 g of the mixture of the digesta and the intestinal wall using the modified method of Nakphaichit et al., (2011). In brief, the bacterial cells were collected from a 10x dilution sample by homogenizing in a stomacher blender (Seward Medical, London) for 2 min followed by centrifugation at 100 xg for 10 min at 4C to remove the debris. One milliliter of supernatant collected was centrifuged at 15,000 xg for 10 min at 4C. The cell pellets obtained which mainly composed of bacteria were washed twice with 1 ml PBS (8 g NaCl, 0.2 g KCl, 1.44 g Na2HPO4, 0.24 g KH2PO4 in 1 L at pH 8.0) and then suspended in 900 µl of PBS. The bacterial suspension mixed with 300 l of phenol–chloroform–isoamyl alcohol (25:24:1) was lysed using a mini–bead beater (Biospec Products Inc., Bartlesville, USA) at 2,700 rpm for 180 sec containing 0.3 g zirconium beads (0.1 mm in diameter, As One Corporation, Osaka, Japan). The cell debris was removed by centrifugation at 20,000 xg for 2 min. The bacterial DNA obtained from upper layer was further purified using the QIAamp DNA Stool Mini Kit (Qiagen, Germany) according to manufacturer’s instructions and stored at –20 C until use.
Villi Measurement
The jejunum and ileum samples were cut by the size of 1.5 × 1.5 cm2, flushed through with saline solution, fixed on foam using pins and placed into 100 g/l buffered formalin for further analysis. Paraffin–embedded tissues were sectioned to a thickness of 5 m. Tissue slides were stained using 0.02% toluidine blue for light microscope measurement. The villous height was measured in from the base of the lamina propria to the apex of the villous. The unit of measurement is micrometre (µM) and all reported villi values were an average of 5 measurements per tissue. Assessments were made only on cleanly sectioned, perpendicular villi as previously described by Sun et al., (2005).
Quantitative Real Time PCR
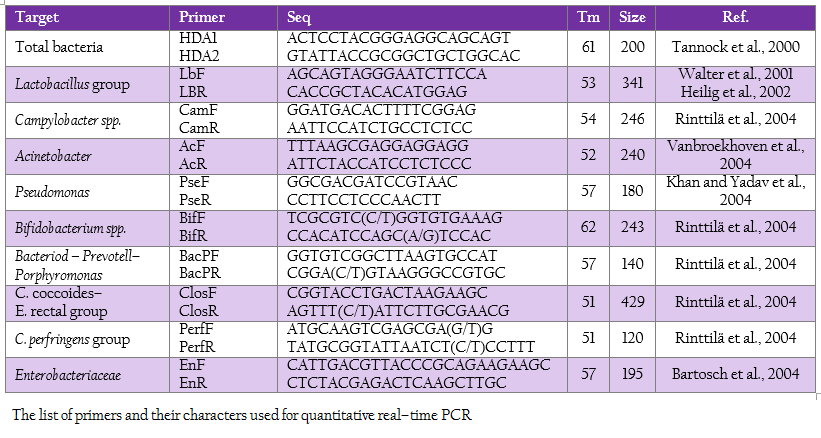
Real time PCR using SYBR technology was used to quantify the target group of microorganism by LightCycler® 480 (Roche, Germany). The oligonucleotide primers, optimal annealing temperature and their PCR products size are summarized in Table 2. To obtain a standard curve for absolute quantification, the modified method of Wise and Siragusa (2007) was performed. Standard curves of total bacteria, Lactobacillus group, Campylobacter, Acinetobacter, Psedomonus, Bifidobacterium, Bacteriodes – Prevotell – Porphyromonas group, Clostridium coccoides–Enterobacter rectal group, C. perfringens group and Enterobacteriaceae were constructed using specific primers to amplify the genomic DNA of Escherichia coli TISTR 527, Lactobacillus salivarius AC21, Campylobacter jejuni ATCC 33291, Acinetobacter calcoaceticus TISTR 360, Pseudomonas sp. TISTR 1249, Bifidobacterium bifidum JCM 1255, Bacteriodes fragilis ATCC 25285, Ruminococcus productus JGD 07421, C. perfringens ATCC 13124 and Salmonella Typhimurium TISTR 292, respectively. Each PCR products were cloned into pGEM–T Easy vector according to manufacturer’s instructions (Promega, Madison, WI). Then, the recombinant plasmids were diluted by serial 10–fold dilution until concentration of 109 was reached. The set of serial dilution series in each group were used as a template for the standard curve. The standard curves were created by LightCycler® 480 software using second derivative maximum (Roach Applied Science, Mannheim, Germany). The slope of the standard curve is used to determine reaction efficiency in which accurate quantification require the efficiency of 1.8–2 (E = 10–1/slope). In addition, the error value is evaluated for the accuracy of the quantification result base on the standard curve. An acceptable value should be < 0.2.
The reaction mixture contained 10 µl of 2x SYBR Green I master mix (Roche, Germany), 0.8 µl of 5 pmol forward and reverse primers, 2 µl of DNA template (50–100 ng) and dH2O added to obtain the final volume of 20 µl. Amplification program included an initial denaturation at 95C for 5 min, followed by 45 cycles consisting of denaturation at 95C for 10 sec, annealing temperature according to the Tm of primer for 10 sec and extension at 72C for 5–18 sec depending on PCR product size. To confirm the specific amplification of the target DNA, dissociation curve was created in the following cycles of a denaturation step at 95 oC for 5 sec, temperature decreasing step to 65C for 1 min and continuous temperature increasing from 65 oC to 97 oC every 12 sec signal measurement. For statistical analysis, in the case where the incidence of detection within treatment group was less than 100%, the remaining undetection replicates were considered to be at the theoretical limit of detection for purpose of calculating the mean and standard deviation.
Short Chain Fatty Acid Analysis
The concentration of lactic acid, acetic acid, propionic acid and butyric acid were measured by high performance liquid chromatography. Samples were prepared using the modification method of Zeppa et al., (2001). Briefly, one gram of digesta and tissue was diluted by adding 4 ml of 0.008 M H2SO4 (mobile phase) and incubated on ice. The cool solution was homogenized every 10 min by vortex mixer for one hour. The supernatant was collected by centrifugation at 15,000 xg for 10 min. The concentration of 0.1%, 0.2%, 0.3%, 0.4% and 0.5% v/v of each acid were performed for their standard curve. The 20 µl of mixture solution containing 3 volume of analyzed sample or standard solution and 1 volume of internal standard (0.2 % w/v tartaric acid) filtered through 0.2 µm PVDF Syringe filters (Verical, Bangkok, Thailand) was injected into BreezeTM 2 HPLC system (Waters, USA) with Rezex ROR–Organic Acid column (Phenomenex, USA) at 60C. Mobile phase was run at the flow rate of 0.6 ml/min. The signal was detected by UV detector at 210 nm. All chemical were purchased in HPLC analytical grade.
Statistical Analysis
All results were analyzed by one way ANOVA test (SPSS program version 12, Munich, Germany). The group difference was determined by LSD and Duncan method. Differences were quantified at significant p ≤ 0.05.
RESULTS
Broiler Performance Response to CP Level
The weekly weight gain, feed consumption and feed conversion ratio of the control and two treatments are represented in Table 3. At the first week, feed consumption of the control was not significantly different from the EAA supplemented group. While feed consumption of the high CP supplemented group was significantly lower than the one of both control and the EAA supplemented group (p = 0.001). However, both weight gain and feed conversion ratio at first week were not significant difference (p > 0.05).
Villi height of jejunum and ileum were determined at week 3 (Table 3). The villi of jejunal region from two treatments with either high CP or EAA supplemented group were significantly shorter than the control for 23%–28.7% of the control (p < 0.05). Whereas the villi size of ileum from all treatments were not significantly different (p ≥ 0.05).
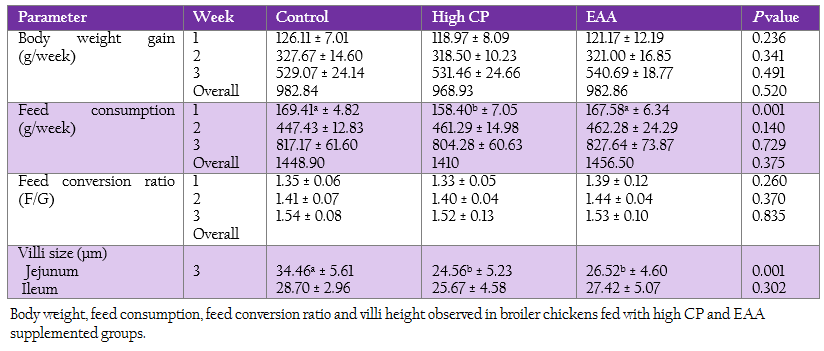
Table 3: Body weight, feed consumption, feed conversion ratio and villi height observed in broiler chickens fed with high CP and EAA supplemented groups.
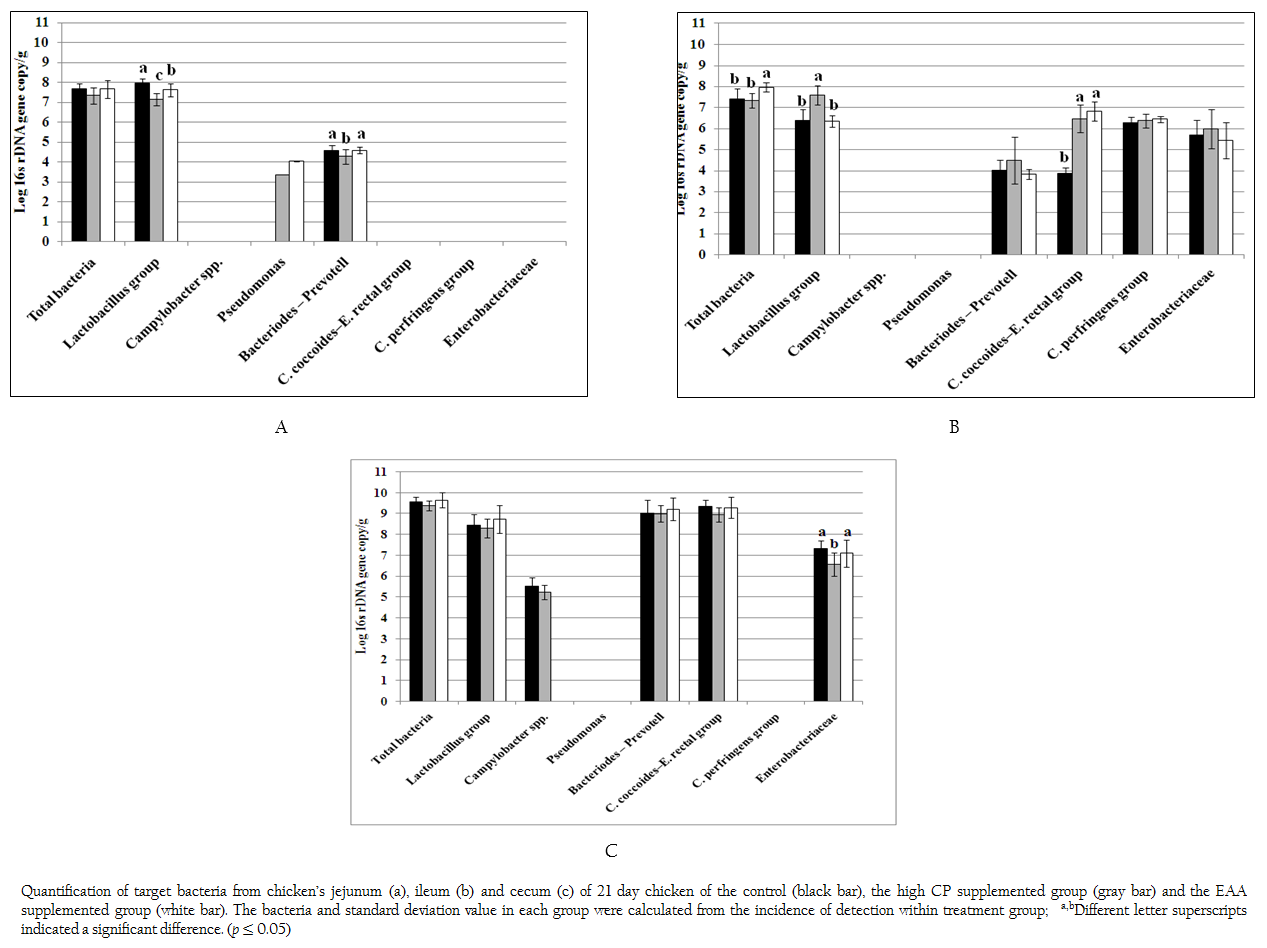
Figure 1: Quantification of target bacteria from chicken’s jejunum (a), ileum (b) and cecum (c) of 21 day chicken of the control (black bar), the high CP supplemented group (gray bar) and the EAA supplemented group (white bar). The bacteria and standard deviation value in each group were calculated from the incidence of detection within treatment group; a,bDifferent letter superscripts indicated a significant difference. (p ≤ 0.05)
Effect of CP and EAA on Intestinal Bacteria
Total bacteria and 9 specific bacterial groups from jejunum, ileum and cecum were analyzed by real time PCR according to region of 16s rDNA gene. Considering to jejunal region (Figure 1a), total bacteria of the control and two treatments were 7.33–7.68 log 16s rDNA gene copies which were not significant difference (p > 0.05). Only three bacterial groups of Bacteroides–Prevotella, Lactobacillus and Pseudomonas were observed. The amount of Bacteroides–Prevotell from the control and the EAA supplemented group were 4.57 and 4.58 log 16s rDNA gene copies, respectively, which were not significant difference (p > 0.05). However, Bacteroides–Prevotella of the control and the EAA supplemented group were significantly higher than high CP supplemented group for 7%. The population of Lactobacillus of three treatments were significantly different (p = 0.001). The highest concentration of Lactobacillus group found in control were 7.98 log 16s rDNA gene copies whereas the lowest one of Lactobacillus group found in high CP supplemented group were 7.16 log 16s rDNA gene copies. Pseudomonas was not found in control treatment but its low concentration of 3.35–4.03 log 16s rDNA gene copies was detected from 1 chicken of two treatments.
In ileum, the total bacteria (7.96 log 16s rDNA gene copies) were significantly promoted in EAA supplemented group (p < 0.05) (Figure 1b). Comparing to jejunum, the microbial community had greater diversity. Additional C. coccoides–E. rectal subgroup, C. perfringens and Enterobacteriaceae were detected while Pseudomonas was not detected at the detection limit of 2 log 16s rDNA gene copies. The amount of Bacteroides–Prevotell, C. perfringens and Enterobacteriaceae from the control and the two treatments were 3.82–4.47, 6.27–6.44 and 5.42–5.96 log 16s rDNA gene copies which showed no significant difference. Interestingly, the copy number of C. coccoides–E. rectal group from high CP and EAA supplemented group were significantly higher than the control for two times (p = 0.001) while the Lactobacillus from high CP supplemented group was significantly higher than the control and EAA supplemented group for 15.9 and 16.5%, respectively (p = 0.001).
In caecal region, total bacteria from the control and two treatments were 9.37–9.65 log 16s rDNA gene copies which were higher than both jejunum and ileum region as shown in Figure 1c. The detected bacterial groups were similar to ileum region except C. perfringens. In addition, low concentrations of Campylobacter were also detected from the control and high CP supplemented group (5.51 and 5.23 log 16s rDNA gene copies) from 6 and 3 chickens, respectively. The concentration of Lactobacillus, Bacteroides–Prevotella group and C. coccoides–E. rectal group (8.30–8.74, 9.0–9.21 and 8.96–9.34 log 16s rDNA gene copies) from the control and two treatments were not significantly different, respectively (p > 0.05). While caeca condition supported similar growth of Enterobacteriaceae from the control and EAA supplemented group but significantly effected to high CP supplemented group with the reduction of 10.0% and 7.91%, respectively.
It was noticed that both Acinetobacter and Bifidobacterium were not observed under limitation of real time PCR in this study at 103 and 102 log 16s rDNA gene copies, respectively.
Effect of CP and EAA on Short Chain Fatty Acids (SCFA)
Short chain fatty acids of acetic acid, butyric acid, lactic acid and propionic acid in jejunum, ileum and cecum were analyzed. Butyric acid was not detected. However, lactic acid and propionic acid were detected from all regions of jejunum, ileum and cecum. The concentration of lactic acid from the jejunum of the control, the high CP supplemented group and the EAA supplemented group were 27.3 (SD=3.3), 26.2 (SD=2.64) and 39.3 (SD=3.74) mol/g, respectively which were higher than propionic acid for 2.1, 1.9 and 3.9 times, respectively (Figure 2). While the concentration of lactic acid from ileum of the control, the high CP supplemented group and the EAA supplemented group were higher than the one of propionic acid for 2, 2.0 and 2.4 times, respectively. However, the amount of both acids from all three experiments was not significantly different (p> 0.05).
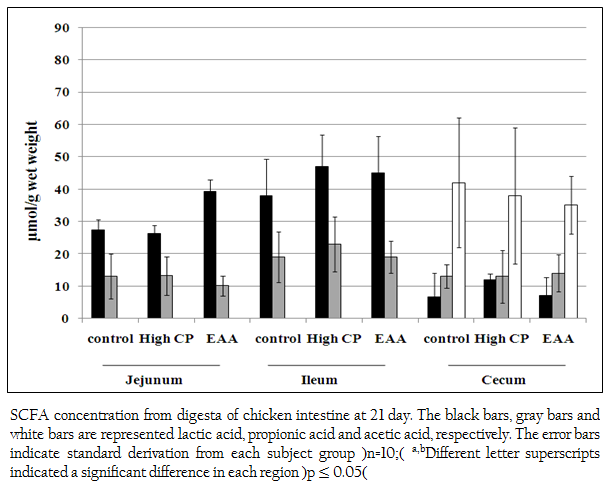
Figure 2: SCFA concentration from digesta of chicken intestine at 21 day. The black bars, gray bars and white bars are represented lactic acid, propionic acid and acetic acid, respectively. The error bars indicate standard derivation from each subject group (n=10); a,bDifferent letter superscripts indicated a significant difference in each region (p ≤ 0.05)
In cecum, not only lactic acid and propionic acid but also acetic acid was detected. The concentration of acetic acid in cecum was the highest. However, the amount of these three acids from all three experiments was not significantly different (p> 0.05).
DISCUSSIONS
The effect of dietary CP and EAA from soybean meal based diet on broiler production and intestinal bacterial community were investigated. Over–dosage of CP and EAA in both high CP and EAA supplemented group had no effect on chicken growth in the term of weight gain and feed conversion ratio. However, addition of CP and EAA affected the length of jejunal villi but not villi length in ileum that was similar to the results of Yamauchi et al., (1996) reporting that the villi height of both duodenum and jejunum from layer–type hens fasted decreased while the one of ileum had no effect. Swatson et al., (2002) reported that addition of excess dietary protein of 20–40% with both balanced and unbalanced amino acid had no effect on chicken weight gain. However, the heights of the jejunum seem to be lower for birds fed ad libitum on the unbalanced amino acid diet. It was possible that excess protein contents of 28% in the form of either crude protein or amino acid studied in this experiment effected on the jejunal chicken might come from unbalanced amino acid. In addition, the number of Lactobacillus expressed as log 16S rDNA gene copies of two treatments from jejuna 21 days were lower than the control. It was possible that the excess unbalanced amino acid would effect to the number of Lactobacillus which is an important commensal friendly bacterial group in intestinal gut.
Ten bacterial groups often found in GI–tract of chicken were studied for their diversities of different intestinal region of jejunum, ileum and cecum. The high number of Lactobacillus producing lactic aid as a major metabolite (Holzapfel et al., 1995) was in parallel with the high concentration of lactic acid detected from jejunum and ileum. However, more microbial diversity occurred at the ileum and cecum. This should be the environmental condition of both ileum and cecum having high pH range of 6.18–6.60 and 5.60–5.83, respectively providing the suitable condition for most bacteria (Gabriel et al., 2006). These caused high number of Bacteroides–Prevotella and C. coccoides–E. rectal group for more than 9 log 16s rDNA gene copies from cecum which were higher than the ones from both jejunum and ileum. In addition, high concentrations of acetic acid were also detected from only cecum part. Bacteroides–Prevotella group is able to metabolize different carbon source to produce acetic acid as a major product while some genus in C. coccoides–E. rectal group especially genus Clostridium and Ruminococcus can utilize lactic acid and produce acetic acid in fermentation process (Hespell, 1987). It was possible that cecum region provided the condition to support the growth of some species of heterofermentative Bacteroides–Prevotella and C. coccoides–E. rectal group and to produce high acetic acid concentration during their growth.
Addition of either soy CP or EAA clearly supported the growth of C. coccoides–E. rectal group in the ileum. It was different from the animal CP source containing high glycine content (Drew et al., 2004) which served as energy or nitrogen source to support the growth of C. perfringens causing subclinical necrotic enteritis in chicken (Wilkie et al., 2005; Dahiya et al., 2007). Notably, Campylobacter group was not detected in the EAA supplemented group but did 60% and 30% in the control and the high CP supplemented group, respectively. Dahiya et al., (2007) reported that 0.8% methionine supplement could reduce pathogenic bacteria like coliform, C. perfringen and Streptococcus group D in ileum. In this study, additional EAA also potentially reduced the number of Campylobacter group. Actually Campylobacter can colonize in chicken intestine without any apparent harmful to the birds. However, its enteritis effect can be observed on human consumers (Bull et al., 2006). Addition of EAA should be therefore realized.
In conclusion, high–dose of CP and EAA in soybean meal based diets had no effect on broiler production. Total viable bacteria and nine specific bacterial groups often found in GI–tract of chicken were studied for their diversities at intestine of jejunum, ileum and cecum. More microbial diversity had occurred at the ileum and cecum region of intestine. Low concentration of Campylobacter, Clostridium perfringens and Pseudomonas were detected from jejunum, ileum and cecum of chicken fed by soybean meal based diet. Addition of high CP and EAA did not effect to those bacterial groups studied except growth promotion of C. coccoides–E. rectal group from ileum at 21 day of age. Either the high CP or EAA supplemented group had no effect to the production of those short chain fatty acid of acetic acid, butyric acid, lactic acid and propionic acid. However, high concentrations of lactic acid detected from both jejunum and ileum concerned to high Lactobacillus concentration of 7–9 log 16s rDNA gene copies. While the concentration of acetic acid detected from only cecum was in parallel with the high number of Bacteroides–Prevotella and C. coccoides–E. rectal. These findings provided that high concentration of C. coccoides–E. rectal detected from additional CP or EAA may assist nutrition strategies to develop healthy chicken production with soybean meal based diet in the future.
ACKNOWLEAGEMENTS
This work was supported by a Royal Golden Jubilee (RGJ) grant from Thailand. The authors thanks Matana Nalumpang for animal health contribution.
REFERENCES
Bartosch S, Fite A, Macfarlane GT, McMurdo MET (2004). Characterization of bacterial communities in feces from healthy elderly volunteers and hospitalized elderly patients by using real–time PCR and effects of antibiotic treatment on the fecal microbiota. Appl. Environ. Microbiol. 70: 3575 – 3581.
http://dx.doi.org/10.1128/AEM.70.6.3575-3581.2004
PMid:15184159 PMCid:PMC427772
Belenguer A, Duncan SH, Holtrop G, Anderson SE, Lobley GE, Flint HJ (2007). Impact of pH on lactate formation and utilization by human fecal microbial communities. Appl. Environ. Microbiol. 73: 6526 – 6533.
http://dx.doi.org/10.1128/AEM.00508-07
PMid:17766450 PMCid:PMC2075063
Bull SA, Allen VM, Domingue G, Jorgensen F, Frost JA, Ure R, Whyte R, Tinker D, Corry JEL, Gillard–King J, Humphrey TJ (2006). Sources of Campylobacter spp. colonizing housed broiler flocks during rearing. Appl. Environ. Microbiol. 72: 645 – 652.
http://dx.doi.org/10.1128/AEM.72.1.645-652.2006
PMid:16391102 PMCid:PMC1352183
Dahiya J, Hoehler D, Wilkie D, Van Kessel A, Drew M (2005). Dietary glycine concentration affects intestinal Clostridium perfringens and lactobacilli populations in broiler chickens. Poult. Sci. 84: 1875 – 1885.
http://dx.doi.org/10.1093/ps/84.12.1875
PMid:16479944
Dahiya JP, Hoehler D, Van Kessel AG, Drew MD (2007). Dietary encapsulated glycine influences Clostridium perfringens and Lactobacilli growth in the gastrointestinal tract of broiler chickens. J. Nutr. 137: 1408 – 1414.
PMid:17513399
Drew M, Syed N, Goldade B, Laarveld B, Van Kessel A (2004). Effects of dietary protein source and level on intestinal populations of Clostridium perfringens in broiler chickens. Poult. Sci. 83: 414 – 420.
http://dx.doi.org/10.1093/ps/83.3.414
PMid:15049494
Gabriel I, Lessire M, Mallet S, Guillot JF (2006). Microflora of the digestive tract: critical factors and consequences for poultry. Worlds. Poult. Sci. J. 62: 499 – 511.
http://dx.doi.org/10.1079/WPS2006111
http://dx.doi.org/10.1017/S0043933906001115
Gong J, Si W, Forster RJ, Huang R, Yu H, Yin Y, Yang C, Han Y (2007). 16S rRNA gene–based analysis of mucosa–associated bacterial community and phylogeny in the chicken gastrointestinal tracts: from crops to ceca. FEMS. Microbiol. Ecol. 59: 147 – 157.
http://dx.doi.org/10.1111/j.1574-6941.2006.00193.x
PMid:17233749
Hespell RB. (1987). Biotechnology and modifications of the rumen microbial ecosytem. Proceeding of the nutrition society. Cambridge University Press, England, Volumn 46: 407 – 413.
PMid:3324099
Holzapfel, WH, Geisen R, Schillinger U (1995). Biological preservation of foods with reference to protective cultures, becteriocins and food–grade enzymes. Int. J. Food Microbiol. 24: 343 – 362.
http://dx.doi.org/10.1016/0168-1605(94)00036-6
Jia W, Slominski BA, Bruce HL, Blank G, Crow G, Jones O (2009). Effects of diet type and enzyme addition on growth performance and gut health of broiler chickens during subclinical Clostridium perfringens challenge. Poult. Sci. 88: 132 – 140.
http://dx.doi.org/10.3382/ps.2008-00204
PMid:19096067
Khan IUH, Yadav JS (2004). Real–time PCR assays for genus–specific detection and quantification of culturable and non–culturable mycobacteria and pseudomonads in metalworking fluids. Mol. Cell. Probe. 18: 67 – 73.
http://dx.doi.org/10.1016/j.mcp.2003.09.004
PMid:15036372
Kim GB, Seo YM, Kim CH, Paik IK (2011). Effect of dietary prebiotic supplementation on the performance, intestinal microflora, and immune response of broilers. Poult. Sci. 90: 75 – 82.
http://dx.doi.org/10.3382/ps.2010-00732
PMid:21177446
Kobayashi H, Nakashima K, Ishida A, Ashihara A, Katsumata M (2013). Effects of low protein diet and low protein diet supplemented with synthetic essential amino acids on meat quality of broiler chickens. Anim. Sci. 84: 489 – 495.
http://dx.doi.org/10.1111/asj.12021
PMid:23607660
Laudadio V, Passantino L, Perillo A, Lopresti G, Passantino A, Khan RU, Tufarelli V (2012). Productive performance and histological features of intestinal mucosa of broiler chickens fed different dietary protein levels. Poult. Sci. 91: 265 – 270.
http://dx.doi.org/10.3382/ps.2011-01675
PMid:22184453
Leeson S, Summers JD (2009). Commercial poultry nutrition: 3rd edition, 3 edn. University books.
Malheiros RD, Moraes VMB, Collin A, Janssens GPJ, Decuypere E, Buyse J (2003). Dietary macronutrients, endocrine functioning and intermediary metabolism in broiler chickens: Pair wise substitutions between protein, fat and carbohydrate. Nutr. Res. 23: 567 – 578.
http://dx.doi.org/10.1016/S0271-5317(03)00022-8
Nakphaichit M, Thanomwongwattana S, Phraephaisarn C, Sakamoto N, Keawsompong S, Nakayama J, Nitisinprasert S (2011). The effect of including Lactobacillus reuteri KUB–AC5 during post–hatch feeding on the growth and ileum microbiota of broiler chickens. Poult. Sci. 90: 2753 – 2765.
http://dx.doi.org/10.3382/ps.2011-01637
PMid:22080014
Palliyeguru MWCD, Rose SP, Mackenzie AM (2010). Effect of dietary protein concentrates on the incidence of subclinical necrotic enteritis and growth performance of broiler chickens. Poult. Sci. 89: 34 – 43.
http://dx.doi.org/10.3382/ps.2009-00105
PMid:20008800
Rezaei M, Nassiri Moghaddam H, Pour Reza J, Kermanshahi H (2004). The effects of dietary protein and lysine levels on broiler performance, carcass characteristics and N excretion. Int. J. Poult. Sci. 3: 148 – 152.
http://dx.doi.org/10.3923/ijps.2004.148.152
Rinttilä T, Kassinen A., Malinen E, Krogius L, Palva A (2004). Development of an extensive set of 16S rDNA–targeted primers for quantification of pathogenic and indigenous bacteria in faecal samples by real–time PCR. J. Appl. Microbiol. 97: 1166 – 1177.
http://dx.doi.org/10.1111/j.1365-2672.2004.02409.x
PMid:15546407
Shakouri MD, Iji PA, Mikkelsen LL, Cowieson AJ (2009). Intestinal function and gut microflora of broiler chickens as influenced by cereal grains and microbial enzyme supplementation. J. Anim. Physiol. Anim. Nutr. 93: 647 – 658.
http://dx.doi.org/10.1111/j.1439-0396.2008.00852.x
PMid:18700849
Sun X, McElroy A, Webb K, Sefton A, Novak C. (2005). Broiler performance and intestinal alterations when fed drug–free diets. Poult. Sci. 84: 1294 – 1302.
http://dx.doi.org/10.1093/ps/84.8.1294
PMid:16156214
Swatson HK, Gous R, Iji PA, Zarrinkalam R (2002). Effect of dietary protein level, amino acid balance and feeding level on growth, gastrointestinal tract, and mucosal structure of the small intestine in broiler chickens. Anim. Res. 51: 501 – 515.
http://dx.doi.org/10.1051/animres:2002038
Tannock GW, Munro K, Harmsen HJM, Welling GW, Smart J, Gopal PK. (2000). Analysis of the fecal microflora of human subjects consuming a probiotic product containing Lactobacillus rhamnosus DR20. Appl. Environ. Microbiol. 66: 2578 – 2588.
http://dx.doi.org/10.1128/AEM.66.6.2578-2588.2000
PMid:10831441 PMCid:PMC110584
Vanbroekhoven K, Ryngaert A, Wattiau P, De Mot R, Springael D (2004). Acinetobacter diversity in environmental samples assessed by 16S rRNA gene PCR–DGGE fingerprinting. FEMS Microbiol. Ecol. 50: 37 – 50.
http://dx.doi.org/10.1016/j.femsec.2004.05.007
PMid:19712375
Walter J, Hertel C, Tannock GW, Lis CM, Munro K, Hammes WP (2001). Detection of Lactobacillus, Pediococcus, Leuconostoc, and Weissella Species in human feces by using group–specific PCR primers and denaturing gradient gel electrophoresis. Appl. Environ. Microbiol. 67: 2578 – 2585.
http://dx.doi.org/10.1128/AEM.67.6.2578-2585.2001
PMid:11375166 PMCid:PMC92910
Wilkie DC, Van Kessel AG, White LJ, Laarveld B, Drew MD (2005). Dietary amino acids affect intestinal Clostridium perfringens populations in broiler chickens. Can. J. Anim. Sci. 85: 185 – 193.
http://dx.doi.org/10.4141/A04-070
Wise MG, Siragusa GR (2007). Quantitative analysis of the intestinal bacterial community in one– to three–week–old commercially reared broiler chickens fed conventional or antibiotic–free vegetable–based diets. J. Appl. Microbiol. 102: 1138 – 1149.
PMid:17381758
Yamauchi K, Kamisoyama H, Isshiki Y (1996). Effects of fasting and refeeding on structures of the intestinal villi and epithelial cells in white Leghorn hens. Br. Poult. Sci. 37: 909 – 921.
http://dx.doi.org/10.1080/00071669608417922
PMid:9034581
Zeppa G, Conterno L, Gerbi V (2001). Determination of organic acids, sugars, diacetyl, and acetoin in cheese by high–performance liquid chromatography. J. Agric. Food Chem. 49: 2722 – 2726.
http://dx.doi.org/10.1021/jf0009403
PMid:11409957


