Advances in Animal and Veterinary Sciences
Research Article
Advances in Animal and Veterinary Sciences 2 (4): 192 – 198Epidemiology and Diagnosis of Peste des Petits Ruminants in Sheep and Goats by Serological, Molecular and Isolation Methods in Gujarat, India
Harshad C. Chauhan1, Hemendra Singh Kher1, Kaushal Kishor Rajak2, Arnab Sen2, Abidali I Dadawala1, Bharat Singh Chandel1
- Department of Microbiology, College of Veterinary Science and Animal Husbandry, Sardarkrushinagar Dantiwada Agricultural University Sardarkrushinagar– 385 506– Banaskantha, Gujarat, India
- Division of Virology, Indian Veterinary Research Institute, Mukteswar–Nainital, India
*Corresponding author: hcchauhan1972@gmail.com
ARTICLE CITATION:
Chauhan HC, Kher HN, Rajak KK, Sen A, Dadawala AI, Chandel BS (2014). Epidemiology and diagnosis of peste des petits ruminants in sheep and goats by serological, molecular and isolation methods in Gujarat, India. Adv. Anim. Vet. Sci. 2 (4): 192 – 198.
Received: 2014–01–16, Revised: 2014–03–03, Accepted: 2014–03–04
The electronic version of this article is the complete one and can be found online at
(
http://dx.doi.org/10.14737/journal.aavs/2014/2.4.192.198
)
which permits unrestricted use, distribution, and reproduction in any medium, provided the original work is properly cited
ABSTRACT
The present study reports the diagnosis of PPRV infection in sheep and goats using serological, molecular and isolation methods. Out of 618 sera screened for presence of PPRV antibodies by c–ELISA in sheep and goats, 324 (52.42 %) were found positive. Among 268 ante mortem samples, 63 (23.50 %) were found to be positive, whereas in post mortem samples 21 (24.70 %) yielded positive results. A high percentage of positive samples were found in sheep (21.68 %) compared to goats (27.55 %). Among the tissue samples tests, lymph nodes yielded highest positivity (71.42 %), followed by spleen (50.00 %), lung (40.00 %), intestine, liver, heart (each 28.57 %) and trachea (20.00 %). Based on the genetic detection of the N gene, 12 samples comprising four nasal swabs, one fecal material, two spleen, two heart, two lymph nodes and one liver were found to be positive for PPRV. The PPRV was successfully isolated from two nasal swabs of goats, and spleen and heart samples of sheep at 6th passage in Vero cells. Relative quantification of PPRV in various tissues from natural outbreaks revealed highest viral load in lymph node and lung samples.
INTRODUCTION
Peste des petits ruminants (PPR), also known as goat plague, is a highly contagious viral disease affecting domestic and wild small ruminants, characterized by erosive stomatitis, enteritis, pneumonia and death (Furley et al., 1987). It is caused by peste des petits ruminants virus (PPRV) which belongs to the Morbillivirus genus of family Paramyxoviridae. Economically, it is the most important disease of small ruminants, particularly in areas where it is endemic. These include countries located between the Sahara and the Equator in Africa, the Middle East and the Indian sub-continent (Roeder et al., 1994, Singh et al., 2004a). In India, first confirmed outbreak of PPR was recorded in village Arasur in Villapuram district of Tamil Nadu in 1987 (Shaila et al., 1989).
PPR can be reported base on the detection of PPRV antibodies, however, in areas where specific vaccination against PPR is practiced, detection of PPRV antibodies may yield false picture of the prevalence of infection since there is no DIVA strategy available for PPRV. Presence of maternal antibodies may further contribute to this problem. Thus, in such cases, detection of PPR virus in clinical samples becomes essential. Rapid detection of infected animals is very much important for PPR control to be effective. Severe cases in which animals show clinical signs in the field can easily be detected through clinical surveillance and detection of antigen in clinical samples. Monoclonal antibody based immunocapture ELISA and s–ELISA have been used extensively for detection of PPRV in field specimen (Singh et al., 2004b). Though these techniques are sensitive and specific further characterization of causative agents is not possible, and these tests can only be used as screening tests. It is therefore, becoming increasingly obvious that the development of molecular diagnostic techniques for detection and differentiation of PPRV and RPV would be advantageous in a variety of circumstances including clinical disease investigation, vaccination programme and epidemiological studies. Molecular biological techniques such as RT–PCR and nucleic acid hybridization have also been used for detection and differentiation of PPR from RPV with higher sensitivity (Shaila et al., 1989; Forsyth and Barrett, 1995 and Couacy–Hymann et al., 2002). The “gold standard” for any diagnostic test is the isolation and identification of causal agent of the specific disease. Therefore, the correct diagnosis of any disease is made only after isolating and characterizing its etiological agent. Even when diagnosis has been carried out by rapid techniques, the virus should always be isolated from field samples for further studies. Virus isolation can also be very valuable as it provides live viruses for biological characterization.
The present study envisaged appraisal of seroepidemiology of PPR in sheep and goats by detection of PPRV antibodies, detection of PPRV antigen and genome in suspected typical as well as atypical clinical and post mortem samples. Further, toisolate the PPRV for relative quantification of PPRV in various tissues. Various workers have reported the existence of PPRV from different parts of country; however, there exists a paucity of information regarding epidemiology based on seroprevalence, detection of PPRV by S–ELISA and RT–PCR in atypical tissues, isolation of virus and distribution of virus in target organs.
MATERIALS AND METHODS
Serum Samples for Seroprevalence Study
A total of 618 sera were collected for detection of PPRV antibodies from sheep and goats belonging to various districts VIZ., Banaskantha, Mehsana, Patan , Sabarkantha and Kachchh of Gujarat, India.
PPR competitive ELISA (c ELISA)
PPR c–ELISA kit, developed at National Morbillivirus Referral Laboratory, Division of Virology, IVRI, Mukteswar, was used for detection of PPRV antibodies. c–ELISA was performed strictly as per the protocol outlined in the user’s manual supplied with the kit (Singh et al.,2004c).
Samples for Detection of PPRV Antigen by Sandwich–ELISA (s–ELISA) Clinical Samples
Ante mortem samples (nasal swabs, anal swabs, eye swabs, whole blood and urine) for PPRV antigen detection were collected from sheep and goats showing symptoms and lesions suggestive of PPR. Nasal, eye and anal swabs were collected using using sterile wooden swab in 500 µl of sterile PBS (0.1 M, pH 7.4). Samples were transported over ice and stored at –20°C till further use. Blood samples were collected in heparinised vaccutainer and stored at 4°C till further use. Urine samples were also collected in sterile vials.
Samples were also collected from post mortem cases of sheep and goats showing symptoms and pathological changes suggestive of PPR. The samples included lymphnode, spleen, lung, liver, kidney, gall bladder, trachea, bile, heart, tongue, brain, intestine, thymus, abomasum and rectum. The piece of sample was collected in sterile vial over ice and stored at –20°C till further use.
The contents of cotton swabs were extracted thoroughly in 500 µl of 1X PBS. Samples were kept at –20oC until further use. The tissue materials were ground in mortar and pestle in sterile 1X PBS (pH 7.4) to make 10 per cent (w/v) tissue suspension. Homogenates were stored at –20oC until tested.
s–ELISA Performance
PPR s–ELISA kit, developed at National Morbillivirus Referral Laboratory, Division of Virology, IVRI, Mukteswar, was used in the present study for the detection of PPRV antigen. S–ELISA was performed strictly as per the protocol outlined in the user’s manual supplied with the kit (Singh et al, 2004b).
Detection of PPRV by RT–PCR
A total of 25 samples were processed which included 20 s–ELISA positive and 5 s–ELISA negative samples. Among 20 s–ELISA positive samples, 6 were nasal swabs, 2 eye swabs, 2 fecal materials, and 10 were tissues viz., lymphnode, heart, spleen, lung and liver. Of the s–ELISA negative samples, 2 were blood, 1 Nasal swab, 1 lymphnode and 1 spleen.
Total RNA was extracted from swab suspension, tissue samples as well as from PPR Vaccine (used as positive control) using RNeasy Mini Kit (Qiagen GmbH, D–40724 Hilden, Germany) based on modified Guanidium–Phenol–Chlorofom procedure (Chomczynski and Sacchi, 1987), whereas from blood samples RNA was extracted with TRI Reagent®. The RNA pellet was dissolved in 20 µl of nuclease free water. Total RNA thus isolated from clinical samples/ tissues and vaccine virus was subjected to reverse transcription using Omniscript RT Kit (Qiagen GmbH, D–40724 Hilden, Germany). The following reagents were added to the tube.
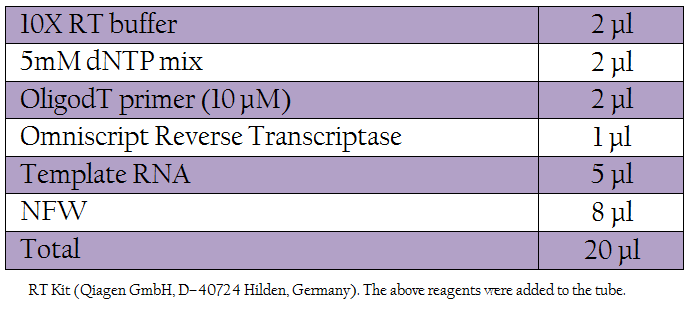
Table 1: RT Kit (Qiagen GmbH, D–40724 Hilden, Germany). The following reagents were added to the tube.
The cDNA (5 µl) thus obtained was used for PCR and the remaining was kept at –20oC until further use.
Polymerase Chain Reaction
The following primers described by Couacy–Hymann et al., 2002 were used in the PCR for confirmation of the PPRV
- NP3a*Forward 5’TCT CGG AAA TCG CCT CAC AGA CTG 3’ 1232–1255
- NP4* Reverse 5’CCT CCT CCT GGT CCT CCA GAA TCT 3’ 1585–1560
- 2.5 l, 50mM MgCl2,0.5l, 10mM dNTPs
- 0.5 l,Forward primer (10 pmol/μl),0.5 l, Reverse primer (10 pmol/μl),0.5 l,cDNA,3.0 l, Taq DNA Polymerase (5U/μl),0.5 l, Nuclease free water,17.0 l
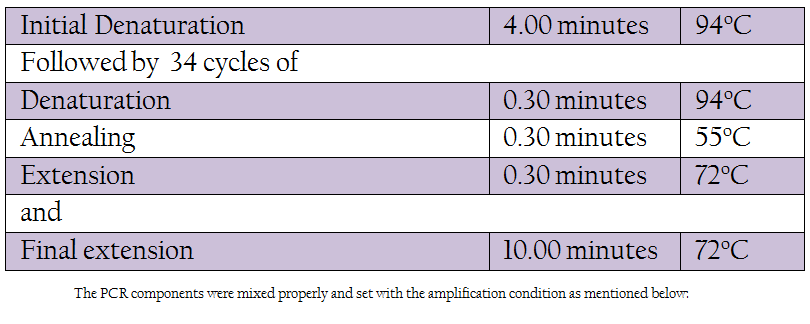
Table 1: The PCR components were mixed properly and set with the amplification condition as mentioned below
The amplicons generated by PCR amplification were resolved on agarose (Sigma–Aldrich, St. Louis, USA) gel electrophoresis using 1X TAE buffer at 100 volt for 45 minutes. The 5 μl of the PCR product was run on 1.5 per cent agarose gel and visualized in a UV transilluminator (Amersham Biosciences AB, Uppsala, Sweden) and documented. Appropriate molecular weight DNA marker (100bp, MBI Fermentas, Maryland, and USA) was used to confirm the product size.
Isolation and Identification of PPRV
For isolation of virus from clinical and post mortem samples The VERO (African green monkey kidney) cell line (ATCC #CCL81) at passage level P–144 was used in this study. Same samples processed for detection of PPRV by N gene based RT–PCR were also used for isolation of PPRV. Nasal swabs, ocular swabs and faecal materials were diluted in 1X PBS and filtered through membrane filter (0.22 m) and the filtrates were used as inoculum for virus isolation. The tissue samples were cut into small pieces and ground in mortar and pestle using sterile sand. To make 10 per cent (w/v) suspension, 1 x PBS (0.01M, pH 7.4) was added, freeze thawed for 2 times and then centrifuged at 2000 rpm for 15 minutes. The supernatants were collected and filtered through membrane filter (0.22 m) and the filtrates were used as inoculum for virus isolation. Whole blood was diluted 1 , 1 in RPMI–1640. Diluted blood was filtered through membrane filter (0.22 m) and the filtrate was used as inoculum for virus isolation. The isolation of PPRV was carried out by adsorption method (Nanda et al., 1996) with little modification. Samples were processed up to 6th passage. The isolates were confirmed by S–ELISA and RT–PCR.
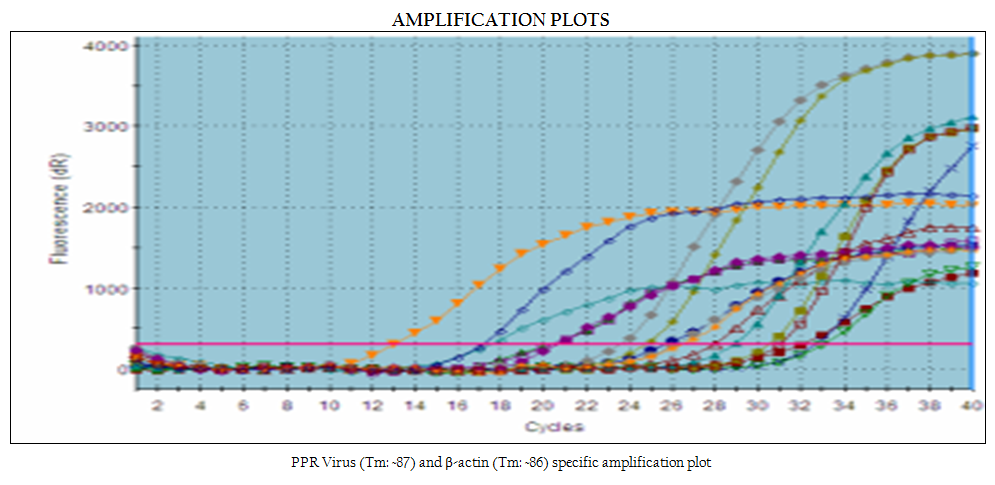
Estimation of Relative PPRV Load in Lung, Lymphnoe and Spleen by Real Time qRT–PCR
Lung, Lymphnodes and Spleen were selected for estimation of relative viral load using SYBR Green I master mix, a two–step RT–PCR kit (QuantiTect® SYBR® Green PCR Master mix, Qiagen GmbH, D–40724 Hilden, Germany). cDNA synthesis was carried out as per the method used above. N GENE primers as used in RT–PCR were used along with β–actin primers
• BA1 , 5’–GAGAAGCTGTGCTACGTCGC–3’
• BA2 , 5’– CCAGACAGCACTGTGTTGGC–3’
Real Time–PCR was performed in Mx 3000p™ machine (Stratagene Inc., LaJolla, CA, USA). Reaction was conducted in 20 μl volume using 10 μl of SYBR Green PCR Master mix, 2 μl of cDNA, 0.5 μl (10 pmol/μl) each of gene specific forward and reverse primers and volume was adjusted up to 20 μl with nuclease free water. PCR was carried out with initial denaturation at 95oC for 15 minutes followed by 40 cycles of amplification with denaturation at 95oC for 30 seconds annealing at 55oC and extension at 72oC for 45 seconds for each cycle. Specificity of the amplified product was assessed by dissociation curve, generated at temperature 55oC through 95oC. The result was expressed as threshold cycle values (Ct). The threshold automatically adjusted by the instrument was used for the generation of Ct values.
Relative Quantification of Viral Load in Different Tissues
For calculation of relative viral load in samples under study, following methodology was adopted.
- First, the TCID50 value of vaccine sample was converted into its antilog 10 values.
- The delta Ct value (difference of Ct value between beta actin and N gene) in vaccine sample was converted into its antilog 2 values
- Now, the antilog 10 of TCID 50 value of vaccine sample (as obtained in 1) was divided by antilog 2 value of delta Ct of vaccine sample (as obtained in 2) in order to calculate the TCID50 values which equates to one fold difference in Real time.
- Similarly, antilog 2 values of the delta Ct values of clinical samples were also converted as described in (2).
- These antilog 2 values of clinical samples were multiplied with the value which equates with actual one fold difference of TCID50 in Real time as calculated in (3).
- The values obtained in Step 5 were again converted into its log 10 values for presentation of result and plotting graphs.
RESULTS
Detection of PPRV Antibodies in Serum by c–ELISA
Out of 618 sera screened from sheep and goats, 324 samples were positive yielding 52.42 per cent seroprevalence. Species wise prevalence in positive reactors was 57.10 per cent in sheep (245 out of 429) and 41.79 per cent in goats (79 out of 324).
Detection of PPRV Antigen by s–ELISA
Out of 353 samples screened for detection of PPRV antigen, 84 samples were found positive using PPR s–ELISA yielding an overall incidence rate of 23.80 per cent. Among the ante mortem samples (n = 268) screened for PPRV antigen 63 (23.50) were found positive, whereas post mortem samples yielded 24.70 per cent positivity (21 out of 85). Of 226 sheep samples and 127 goat samples screened for PPRV antigen, 49 (21.68 %) and 35 (27.55 %) showed the presence of PPRV antigen respectively in PPR s–ELISA (Plate 11). Of the 131 nasal swabs tested, 49 (37.40 %) yielded positive results. Among other samples, 13.33 per cent (04 out of 30) eye swabs and 19.60 per cent (10 out of 51) rectal swabs/fecal materials were found to be positive for PPRV antigen in s–ELISA.
Out of 85 samples collected from post mortem, 21 (24.70 %) were positive and of these post mortem tissues lymph nodes yielded highest positivity of 71.42 per cent (05 out of 07 samples); followed by spleen, 50.00 per cent (05 out of 10), lung 40.00 per cent (04 out of 10), intestine 28.57 per cent (2 out of 7 samples). Out of 5 tracheal samples screened, only one (20.00 %) was found positive. Among atypical clinical samples such as blood, plasma, serum and urine tested for PPRV antigen by s–ELISA, none of the samples was found positive. Among atypical tissues, 2 (28.57 %) liver samples and 2 (28.57 %) heart samples were found positive for PPRV antigen, whereas none of the kidney, bile/gall bladder, mesentery, thymus, brain, tongue, rectum and caecum samples was found positive for PPRV antigen.
Detection of PPRV by RT–PCR
In the present study, reference vaccine virus as well as 4 nasal swabs, 1 faecal material and 7 tissue samples (2 spleen, 2 heart, 2 lymph node and 1 liver samples) produced approximately 351 bp amplicons with primer pair NP3a (modification of NP3 i.e., substitution at bases 17 and 21) and NP4 (Figure 1).
Isolation and Identification of PPRV
In the present study, attempts were also made to isolate the PPRV from ante–mortem and post–mortem tissues in Vero cells. Among all the samples, only two nasal swabs (goat origin), one spleen (sheep) and one heart (sheep) at fourth, fifth and sixth passage levels revealed characteristic cytopathic effect (CPE) of PPRV. In Vero cells, CPE was characterised initially by rounding and ballooning of cells,
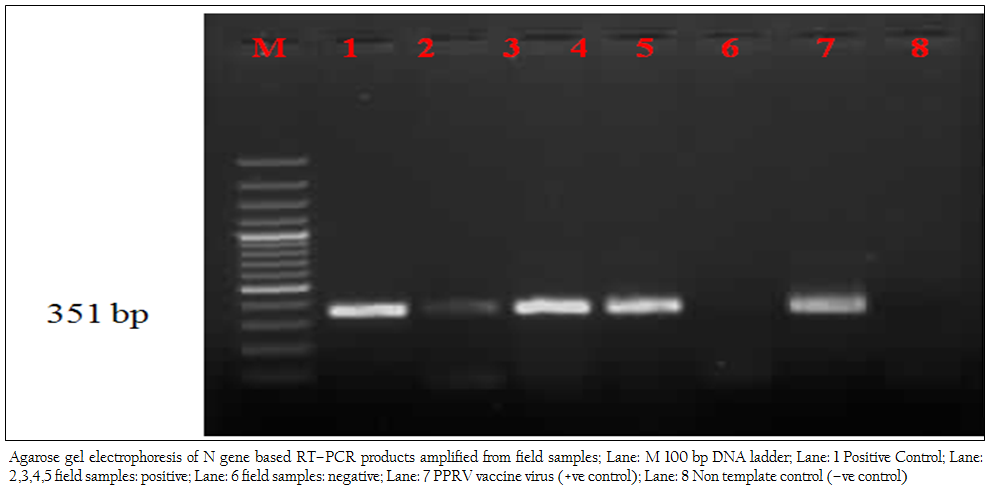
Figure 1: Agarose gel electrophoresis of N gene based RT–PCR products amplified from field samples; Lane: M 100 bp DNA ladder; Lane: 1 Positive Control; Lane: 2,3,4,5 field samples: positive; Lane: 6 field samples: negative; Lane: 7 PPRV vaccine virus (+ve control); Lane: 8 Non template control (–ve control)
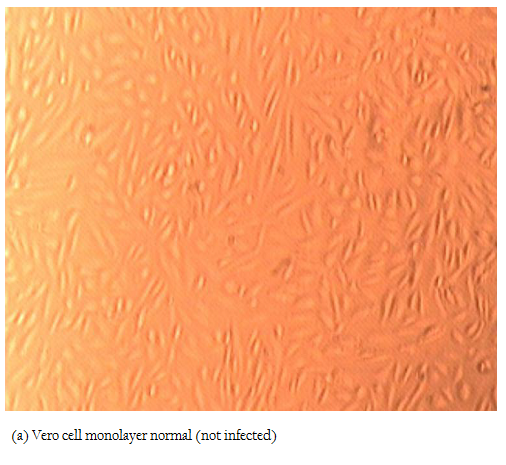
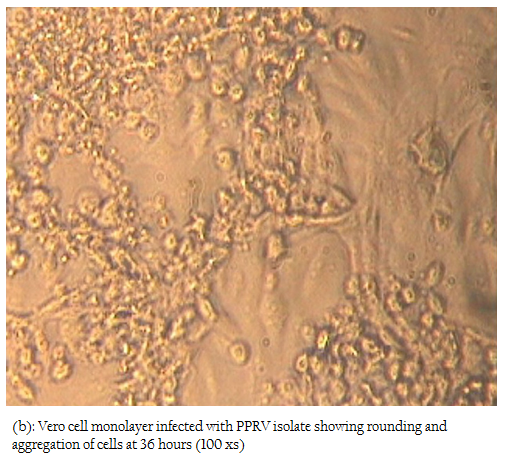
Figure 2b: Vero cell monolayer infected with PPRV isolate showing rounding and aggregation of cells at 36 hours (100 xs)
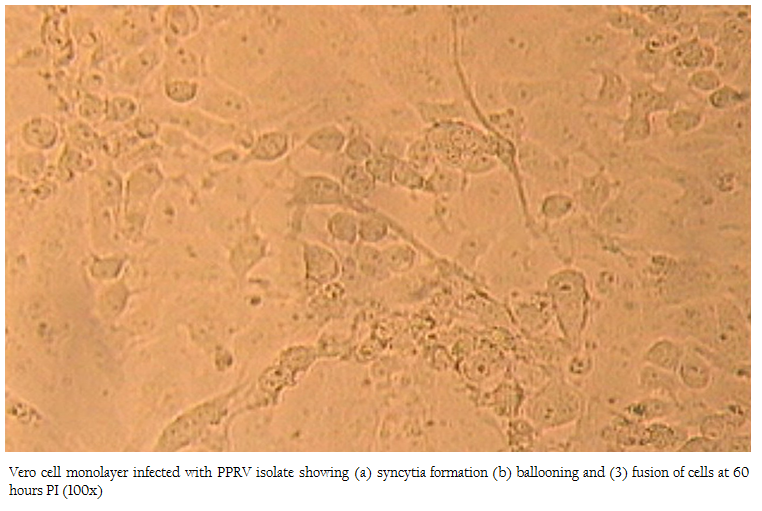
Figure 3: Vero cell monolayer infected with PPRV isolate showing (a) syncytia formation (b) ballooning and (3) fusion of cells at 60 hours PI (100x)
later–on aggregation of cells followed by formation of fusion mass and syncytia. Cell lysis was also observed in some cases (Figures 2, 3). Thus, among four isolates, 2 were from sheep and 2 were from goats. The PPRV isolates were confirmed by S–ELISA and RT–PCR as per the protocols mentioned above. Infected cell lysates were tested after each passage level by PPR sandwich ELISA for PPRV antigen. All the samples after first passage in Vero were detected negative for PPRV antigen. However, after fourth and fifth passage, 2 nasal swabs, 1 spleen and one heart sample were found positive for PPRV antigen. Similarly, Reference vaccine virus as well as all 4 isolates produced approximately 351 bp amplicons with primer pair NP3a and NP4.
Estimation of Relative PPRV Load in Different Tissues by Real Time PCR
Relative viral load was calculated in lung, spleen and lymph
node samples of experimentally infected animals, along with four samples viz., two lymph nodes, one lung and one spleen collected from field cases. Out of these seven tissue samples, highest (6.44 TCID50) and lowest (4.64 TCID50) viral load was estimated in lymph node from field sample and lung from experimentally infected animal, respectively figure 4.
DISCUSSION
In the present study, a total of 618 sera were screened from sheep and goats and of these, 324 (52.42 %) were found to be positive for PPRV antibodies. Khan et al., (2007) have also reported similar seroprevalence rate of 51.29 per cent in Pakistan. Small ruminants in North Gujarat and Kachchh regions are generally farmed on free–range pasture land. These animals often travel long distances during dry season in search of fodder and water. PPRV is transmitted through direct contact in between infected and susceptible animals and nomadic animals often come into contact with local sheep and goat population from whom they contract virus. Ozkul et al., (2002) in Turkey also observed similar pattern of higher seroprevalence of PPRV in adjoining areas. The detection of high prevalence of antibodies against PPRV in sera collected from field samples of sheep and goats in this study indicated the exposure of these animals to the field virus as no vaccination with PPR vaccine was carried out previously. The higher prevalence of antibodies to PPRV in the sheep versus goats should not be misinterpreted as an increase susceptibility of sheep to infection with PPRV. Rather, this may be attributed to a higher recovery rate (lower case fatality rate) and/or a greater longevity of sheep versus goat. Male goats are sold for meat at the local market at approximately one year of age (the age at which the desired body weight is reached) . Recovered (convalescent) animals will have detectable levels of circulating antibody in their sera. The presence of a large proportion of animals in sheep population which have continuous exposure to the virus and have recovered from previous infections with PPRV and are maintained in the flock over many years for the purpose of wool production may indirectly account for the high prevalence of antibodies to PPRV in sheep as compared to goats (Singh et al., 2004a).
Detection of PPRV antibodies can confirm the diagnosis of PPR, however, in areas where specific vaccination against PPR is practiced, detection of PPRV antibodies may yield false picture of the prevalence of infection. Presence of maternal antibodies may further contribute to this problem. Thus, in such cases, detection of PPR virus in clinical samples becomes essential. Rapid detection of infected animals is very much important for PPR control to be effective. Severe cases in which animals show clinical signs in the field can easily be detected through clinical surveillance and detection of antigen in clinical samples. Monoclonal antibodies based s–ELISA has often been used, which is rapid and highly sensitive (Singh et al., 2004a). In the present study, therefore, the presence of antigen in clinical samples was detected through the use of a s–ELISA employing a detection antibody directed against an epitope of nucleoprotein (N) of PPRV.
Out of 353 samples screened for detection of PPRV antigen employing PPR s–ELISA, 84 samples were found positive yielding an overall incidence rate of 23.80 per cent. Among the ante mortem samples (n = 268) screened for the presence of PPRV antigen, 63 (23.50 %) were found positive, whereas, postmortem samples yielded 24.70 per cent positivity (21 out of 85 samples).
Of 226 sheep samples and 127 goat samples screened for PPRV antigen, 49 (21.68 %) and 35 (27.55 %) showed the presence of PPRV antigen, respectively. It revealed that goats were more susceptible to PPRV infection than sheep, which is in agreement with observations made by Kumar et al., (2002) in India and Abubakar et al. (2008) in Pakistan. Reasons for such variable epidemiological situation, outbreaks in sheep–only, goat–only or both the species are not known. Partial N and H gene sequences of the virus isolates involved in sheep or goat outbreaks in Israel have not revealed a clue to explain this situation. There is no indication of the existence of PPRV variants more adapted to one than to another small ruminant species (Diallo, 2003). However, a systemic study involving large number of samples from sheep and goats coupled with well-designed experimental study may yield a scientific clue to the species wise more/less incidence of PPR in sheep and goats.
Of the 131 nasal swab samples tested, 49 (37.40 %) yielded positive results. Among other samples, 13.33 per cent (04 out of 30) eye swabs and 19.60 (10 out of 51) anal swabs/fecal material were found to be positive for PPRV antigen in s–ELISA. Surprisingly, none of the blood, plasma or serum samples was found to be positive.
In post mortem tissues, out of 85 samples, 21 (24.70 %) were positive and of these, lymphnodes yielded highest positivity of 71.42 per cent (5 out of 7 samples), followed by spleen, 50.00 per cent (5 out of 10), lung 40.00 per cent (4 out of 10). Liver, heart and intestine each yielded 28.57 per cent positivity (2 out of 7 samples). Out of 5 tracheal samples screened, only one was found positive. While none of the kidney, bile/gall bladder, mesentery, brain, abomasums, rectum, tongue, caecum and thymus samples was found to be positive for PPRV antigen. Similar observations were also made by earlier workers. The low prevalence observed in post mortem tissues during current study might be due to the inclusion of atypical tissues like brain, thymus, liver, kidney gall bladder, heart and tongue.
Abegunde and Adu (1977) suggested that PPRV excretion was more in occular, nasal and oral secretion of sheep and Goat during early infection whereas excretion was more in faeces in late phase of disease. Antigen secretion starts soon after hyperthermia (6 to 7 days post infection) so, antigen could be detected in occular and nasal secretion six day post infection (Libeau et al., 1994). Outcome of the present findings is that nasal swabs may be the choice of material for detection of PPRV antigen in affected animals. The reason may be that the maximum quantity of antigen is secreted in nasal discharge.
In present study, we failed to detect PPRV antigen in serum, plasma and blood samples. Comparatively higher positivity rate in tissue samples than blood/serum/ plasma as observed in the present study can also be explained by the fact, that it is possible that few of the animals might not be in viraemic stage at the time of collection of blood samples. As tissues are collected on post– mortem, the virus after causing sufficient damage to the level of death obviously remains in active growth phase and hence may turn out to be more positive.
In the present investigation, N gene based RT–PCR was performed for the detection of PPRV genome directly from the clinical samples and postmortem tissues. A total of 25 samples tested for the detection of PPRV using N–gene based RT–PCR only 12 samples (48.00 %) were found positive, which included 4 nasal swabs, 1 faecal material and 7 tissue samples (2 Spleen, 2 heart, 2 Lymphnode, 1 liver samples) as well as reference vaccine virus (positive control). Samples which were positive in s–ELISA were found negative in N gene based RT–PCR, which might be due to the presence of PCR inhibitors or degradation of viral RNA in these samples. Andreoletti et al., (1996) observed that the faecal samples and haemoglobin in lung samples might have an adverse effect on the efficacy of PCR amplification. However, we feel that viral RNA in the RT–PCR negative samples could have been degraded (thermal degradation). A possible weak point of the RT–PCR is that viral RNA is susceptible to degradation and damage unless cold conditions are ensured for collection, storage and transport of clinical samples as well as during extraction of RNA and preparation of cDNA.
The “gold standard” for any diagnostic test is the isolation and identification of causal agent of the specific disease. Therefore, the correct diagnosis of any disease is made only after isolating and characterizing its etiological agent. Present study was aimed to isolate the PPRV from various suspected clinical and postmortem tissue samples in Vero cells. A total of 25 samples which included, 13 clinical samples and 12 postmortem tissues were processed for detection of PPRV antigen by using s–ELISA before isolation of virus in cell culture. Among all these samples, only two nasal swab samples (goat origin), one spleen (sheep) and one heart (sheep) at fourth passage revealed characteristic CPE of PPRV. The virus could not be detected in first three passages by either s–ELISA or RT–PCR. It might be possible that the amount of virus was not enough so as to be detected by the tests employed. However, in fourth passage and in subsequent passages the virus could be detected in s–ELISA and RT–PCR based on N gene (NP3 and NP4) in cell culture supernatant. Due to fragile nature of the Morbilliviruses, it is often not possible to isolate the virus in clinical samples. During the present study, CPE was characterized by ballooning of cells and later–on aggregation of the cells followed by formation of fusion mass and syncytia during sixth passage, which was of more intensity in subsequent passages. Cell lyses was also observed in some cases.
The pattern of PPR infection is largely determined by the property of tropism of PPRV to host cells. Cellular receptors are one of the major determinants of the host range restriction and tissue tropism. All the viruses initiate infection of susceptible cells by first binding to cell surface receptors. Although, PPR virus enters the host through respiratory tract, like other Morbilliviruses, the major site for viral replication is lymphoid tissues (Tatsuo et al., 2001). In our study we successfully, isolated PPRV from spleen sample but failed to isolate PPRV from lymphnode samples.
Surprisingly, PPRV could be isolated from heart sample collected from sheep. Perhaps the unusual virus localisation in myocytes resulted from the prolonged period of infection. Kul et al., (2007) explained similar reason, while detecting PPRV antigen in heart tissues by immunohistochemistry.
Probably the reason of failure in the virus isolation can depend on a lot of factors such as the quantity of the virus in the material, the suitability of material for isolation study, the sampling and delivery time of the material as well as the virus inactivation which develops due to the labile character of the virus in the virus isolation procedure.
In the present study, real time qRT–PCR based relative viral load of PPRV was estimated in selected tissues like lung, spleen and lymphnodes collected from PPRV suspected field cases and animal experimentally infected with PPRV. The choice of samples to study viral load was based on the possible predilection sites of the PPRV. Relative viral load was calculated in lung, spleen and lymphnode samples of experimentally infected animals available at National Morbillivirus Referral Laboratory, Division of Virology, IVRI, Mukteswar along with four samples of present study viz., two lymphnodes, one lung and one spleen collected from field cases. Out of these seven tissue samples, highest (6.44 TCID50) and lowest (4.64 TCID50) viral load was estimated in lymph node from field sample and lung from experimentally infected animal, respectively. In experimental samples, highest viral load estimated was 5.59 TCID50 in spleen followed by 5.06 TCID50 in lymphnode and 4.64 TCID50 in lung. Among field samples, lymphnode showed highest load of 6.44 TCID50 followed by 6.09 TCID50 in lung and 5.26 TCID50 in spleen.
Thus, in field samples lymphnode showed highest viral load, whereas in experimentally infected animal spleen showed highest viral load. Interestingly, among field samples lymphnode and lung samples showed higher viral load compared to that of experimentally infected animal. In initial stage, virus localises in the spleen and as the disease progresses towards the death of the animal, virus migrates to lymphnode and lungs and concentration of virus increases in these organs. This might be the possibility for the highest load of virus in lymphnode followed by lungs in natural outbreaks. Generally, experimentally infected animals are sacrificed in stipulated time before the disease progresses towards the death of animals. Therefore, virus does not get sufficient time to increase the concentration in lungs and lymphnode. This might be the reason for the highest virus load in spleen in experimentally infected animal. The present study will be of use in formulating effective control measures for PPR.
ACKNOWLEDGEMENTS
We are thankful to Dr.V.P.Vadodaria, Dean and Principal, College of Veterinary Science and AH, SDAU, Sardarkrushinagar and Dr. R.K.Singh, Head and Station–In–Charge, IVRI, Mukteswar for providing necessary facilities for present work. Help and cooperation provided by field veterinarians at the time of collection of clinical and post mortem samples are highly acknowledged.
REFERENCES
Abegunde AA, Adu F. (1977). Excretion of the virus of Peste des petits ruminants by goats. Bull. Anim. Health Prod. Africa. 25: 307 – 311.
Abubakar M, Jamal SM, Hussain M, Ali Q (2008). Incidence of Peste des petits ruminants (PPRV) virus in sheep and goat as detected by immuno–capture ELISA (Ic–ELISA). Small Ruminant Res. 75: 256 –259.
http://dx.doi.org/10.1016/j.smallrumres.2007.12.001
Andreoletti L, Hober D, Belaich S, Lobert PE, Dewilde A, Wattre P (1996). Rapid detection of adenovirus in the clinical specimens using PCR and micro well capture hybridization assay. J. Virol. Methods. 62: 1 – 10.
http://dx.doi.org/10.1016/0166-0934(96)02080-0
Chomczynski P, Sacchi N (1987). Single–step method of RNA isolation by acid guanidinium thiocyanate–phenol–chloroform extraction. Anal. Biochem. 162: 156 – 159.
http://dx.doi.org/10.1006/abio.1987.9999
http://dx.doi.org/10.1016/0003-2697(87)90021-2
Couacy–Hymann E, Roger F, Hurard C, Guillou JP, Libeau G, Diallo A (2002). Rapid and sensitive detection of Peste des petits ruminants virus by a polymerase chain reaction assay. J. Virol. Methods. 100: 17 –25.
http://dx.doi.org/10.1016/S0166-0934(01)00386-X
Diallo A (2003). Peste des petits ruminants. Featured article published in the website http,//www.indiveterinarycommunity.com
Forsyth MA, Barrett T (1995). Evaluation of polymerase chain reaction for the detection and characterization of rinderpest and Peste des petits ruminants viruses for epidemiological studies. Virus Res. 39 (2–3): 151 –63.
http://dx.doi.org/10.1016/0168-1702(95)00076-3
Furley CW, Taylor WP, Obi TU (1987). An outbreak of Peste des petits ruminants in a Zoological collection. Vet. Rec. 121 : 443 – 447.
http://dx.doi.org/10.1136/vr.121.19.443
PMid:3424615
Khan HA, Siddique M, Arshad MJ, Khan QM, Rehman SU (2007). Seroprevalence of PPR virus in sheep and goats in Punjab province of Pakistan. Pakistan Vet. J. 27: 109 – 112.
Kul O, Kabakci N, Atmaca T, Ozkul A (2007). Natural Peste des petits ruminants virus Infections, Novel pathogenic finding resembling other Morbillivirus Infections. Vet. Pathol. 44: 1 – 10.
http://dx.doi.org/10.1354/vp.44-4-479
PMid:17606509
Kumar P, Kumar R, Sharma A, Tripathi BN (2002). Pathology of Peste des petits ruminants (PPR) in goats and sheep, spontaneous study. Indian J. Vet. Pathol. 26: 15 – 18.
Libeau G, Diallo A, Colas F, Guerre L (1994). Rapid and differential diagnosis of rinderpest and Peste des petits ruminants using an immunocapture ELISA. Vet. Rec. 134: 300 – 304.
http://dx.doi.org/10.1136/vr.134.12.300
PMid:8009788
Nanda YP, Chatterjee AK, Purohit A, Diallo A, Innui K, Libeau G, Thevasagayam JA, Bruning A, Kitching RP, Anderson J, Barrett T, Taylor WP (1996). The isolation of Peste des petits ruminants virus from Northern India. Vet. Microbiol. 51(3–4): 207 – 216.
http://dx.doi.org/10.1016/0378-1135(96)00025-9
Ozkul A, Akca Y, Alkan F, Barrett T, Karaoglu T, Dagalp SB, Anderson J, Yesilbag K, Cokcaliskan C, Gencay A, Burgu I (2002). Prevalence, distribution and host range of Peste des petits ruminants virus, Turkey. Emerg. Infect. Dis. 8: 708 - 712
http://dx.doi.org/10.3201/eid0807.010471
PMid:12095439 PMCid:PMC2730320
Roeder PL, Abraham G, Kenfe G, Barrett T (1994). Peste des petits ruminants in Ethiopian goats. Trop. Anim. Health Prod. 26(2): 69 – 73.
http://dx.doi.org/10.1007/BF02239901
PMid:7941031
Shaila MS, Purushothaman V, Bhavasar D, Venugopal K, Venkatesan RA (1989). Peste des petits ruminants of sheep in India. Vet. Rec. 125: 602.
PMid:2609485
Singh RP, Saravanan P, Sreenivasa BP, Singh RK, Bandyopadhyay SK (2004a). Prevalence and distribution of Peste des petits ruminants virus infection in small ruminants in India. Rev. Sci. Tech. Int. Epizoot. 23: 807 – 819.
Singh RP, Sreenivasa BP, Dhar P, Bandyopadhyay SK (2004b). A sandwich–ELISA for the diagnosis Peste des petits ruminants (PPR) infection in small ruminants using anti–nucleocapsid protein monoclonal antibody. Arch. Virol. 149: 2155 – 2170.
http://dx.doi.org/10.1007/s00705-004-0366-z
PMid:15503204
Singh RP, Sreenivasa BP, Dhar P, Shah LC, Bandyopadhyay SK (2004c). Development of a monoclonal antibody based competitive ELISA for detection and titration of antibodies to Peste des petits ruminants (PPR) virus. Vet. Microbiol. 98(1): 3 - 15.
http://dx.doi.org/10.1016/j.vetmic.2003.07.007
PMid:14738776
Tatsuo H, Ono N, Yanagi Y (2001). Morbilliviruses use signaling lymphocyte activation molecules (CD150) as cellular receptors. J. Virol. 75: 5842 –5850.
http://dx.doi.org/10.1128/JVI.75.13.5842-5850.2001
PMid:11390585 PMCid:PMC114299


