Advances in Animal and Veterinary Sciences
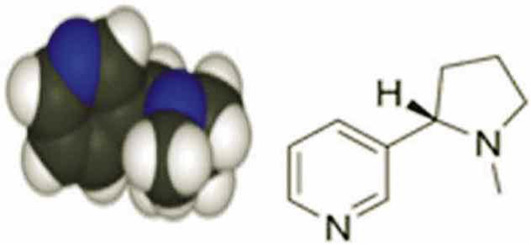
Nicotine Structural chemical formula (Jalili et al., 2014). N (nitrogen), H (hydrogen).
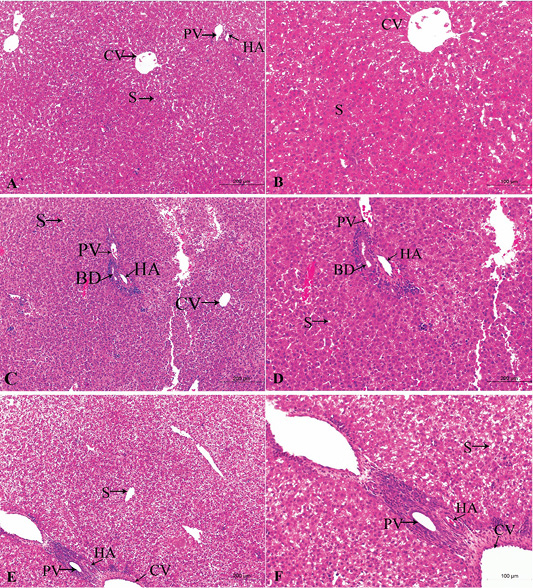
A photomicrograph of the neonatal liver at PND 7 showing the normal liver tissue in Group A (A, X100; B, X400) and the pathological effects of nicotine on the liver in Group B (C, X100; D, X400) and Group C (E, X100; F, X400). Central vein (CV), Portal vein(PV), Hepatic artery branch (HA), Bile duct (BD), Sinusoid (S).
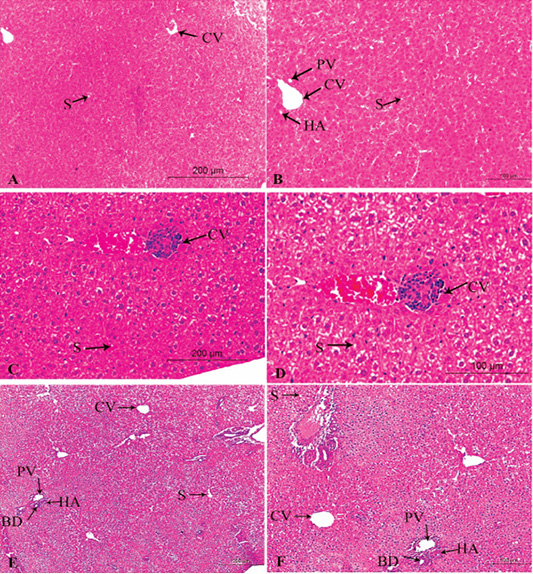
A photomicrograph of the neonatal liver at PND 14 showing the normal liver tissue in Group A (A, X100; B, X400) and the pathological effects of nicotine on the liver in Group B (C, X100; D, X400) and Group C (E, X100; F, X400). Central vein (CV), Portal vein(PV), Hepatic artery branch (HA), Bile duct (BD), Sinusoid (S).
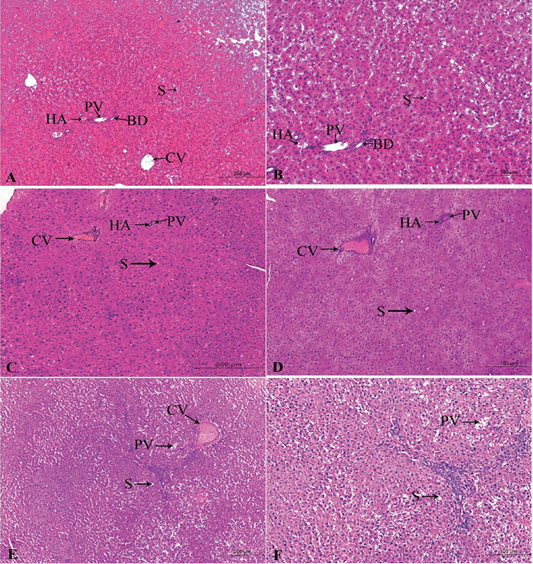
A photomicrograph of the neonatal liver at PND 21 showing the normal liver tissue in Group A (A, X100; B, X400) and the pathological effects of nicotine on the liver in Group B (C, X100; D, X400) and Group C (E, X100; F, X400). Central vein (CV), Portal vein(PV), Hepatic artery branch (HA), Bile duct (BD), Sinusoid (S).
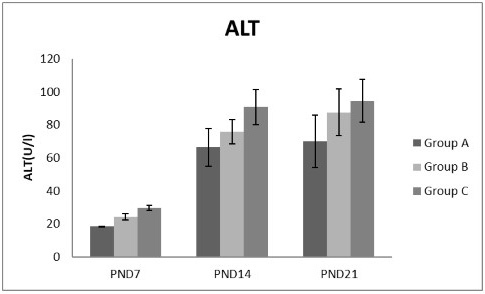
A photograph showing the effect of different nicotine doses on alanine transaminase (ALT) in blood serum of newborn at PND 7, 14 and 21. Group A (Control group), Group B (0.5 mg/kg nicotine) and Group C (1.5 mg/kg nicotine). Values were represented as Mean± SD, n=8 rats.
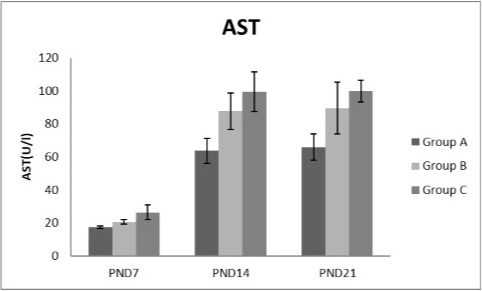
A photograph showing the effect of different nicotine doses on aspartate transaminase (AST) in blood serum of newborn at PND 7, 14 and 21. Group A (Control group), Group B (0.5 mg/kg nicotine) and Group C (1.5 mg/kg nicotine). Values were represented as Mean± SD; n=8 rats.
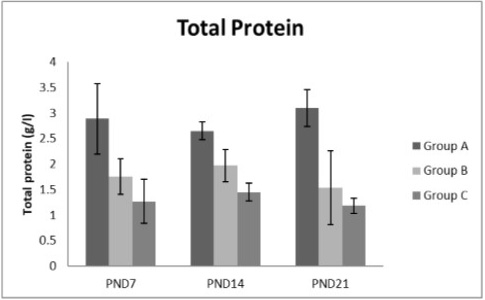
A photograph showing the effect of different nicotine doses on total protein in blood serum of newborn at PND 7, 14 and 21. Group A (Control group), Group B (0.5 mg/kg nicotine) and Group C (1.5 mg/kg nicotine). Values were represented as Mean± SD; n=8 rats.
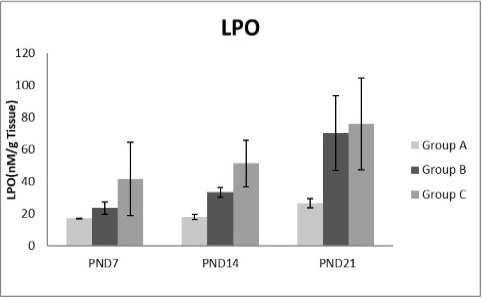
A photograph showing the effect of different nicotine doses on lipid peroxidase (LPO) in liver tissue of newborn at PND 7, 14 and 21. Group A (Control group), Group B (0.5 mg/kg nicotine) and Group C (1.5 mg/kg nicotine). Values were represented as Mean± SD; n=8 rats.
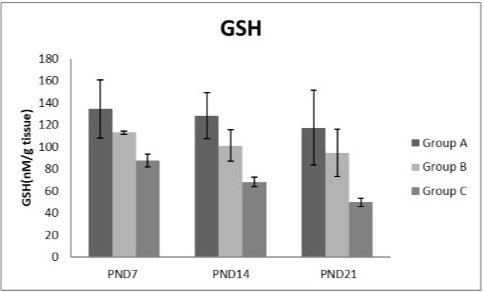
A photograph showing the effect of different nicotine doses on GSH in liver tissue of newborn at PND 7, 14 and 21. Group A (Control group), Group B (0.5 mg/kg nicotine) and Group C (1.5 mg/kg nicotine). Values were represented as Mean± SD; n=8 rats.
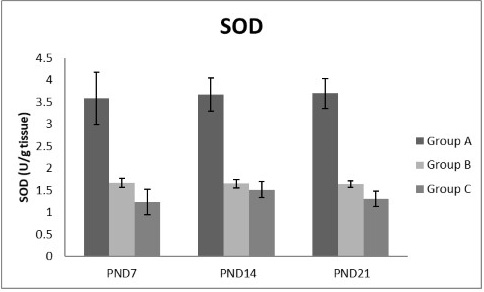
A photograph showing the effect of different nicotine doses on SOD in liver tissue of newborn at PND 7, 14 and 21. Group A (Control group), Group B (0.5 mg/kg nicotine) and Group C (1.5 mg/kg nicotine). Values were represented as Mean± SD; n=8 rats.
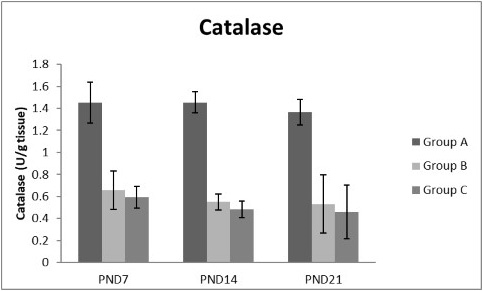
A photograph showing the effect of different nicotine doses on catalase in liver tissue of newborn at PND 7, 14 and 21. Group A (Control group), Group B (0.5 mg/kg nicotine) and Group C (1.5 mg/kg nicotine). Values were represented as Mean± SD; n=8 rats.


