Advances in Animal and Veterinary Sciences
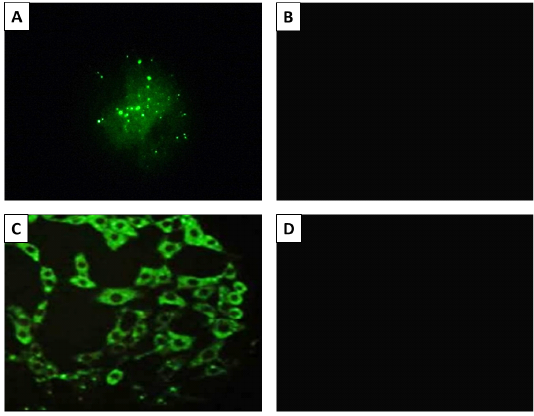
The result of fluorescent antibody technique (FAT) Panel A; Positive (bright green apple fluorescence) on brain impression smear. Panel B; Negative control sample, Panel C; Positive fluorescence on BHK-21 cells inoculated with Rabies virus. Panel B; Negative control (uninfected cells). 400X magnification.
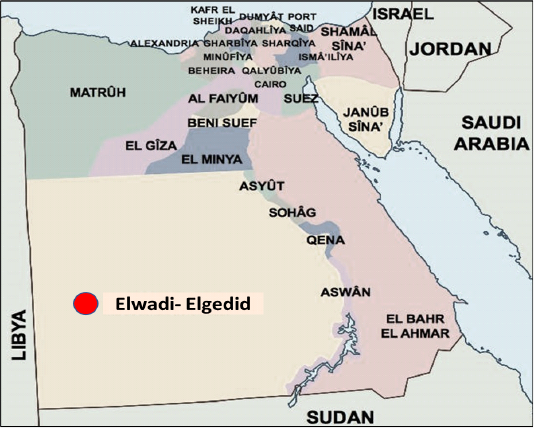
Geographical localities of rabies virus samples in Egypt including Elwadi- Elgedid.

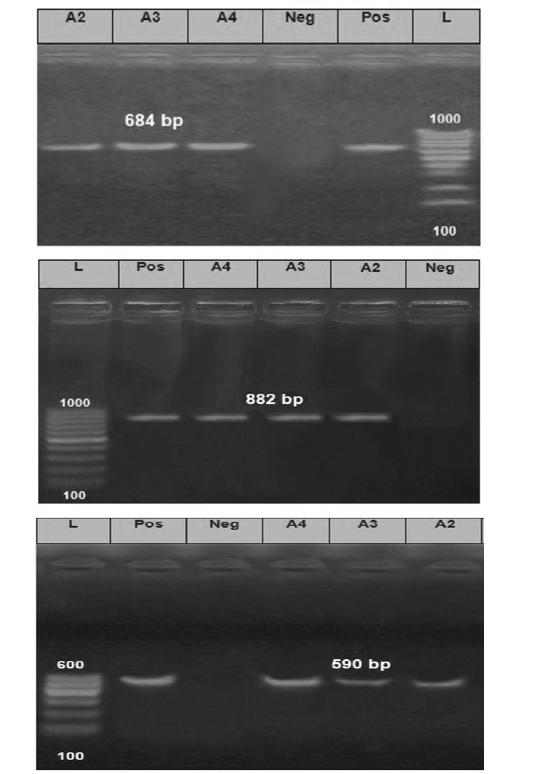
The Electrophoretic pattern of the RT- PCR products to the brain samples (Lab codes; A2, A3 and A4) on the gel electrophoresis (1.5%), Panel A; G gene (590 bp), Panel B; N gene (684bp) and Panel C; P gene (882 bp). Positive and negative controls are included.
The Electrophoretic pattern of the RT- PCR products to the brain samples (Lab codes; A2, A3 and A4) on the gel electrophoresis (1.5%), Panel A; G gene (590 bp), Panel B; N gene (684bp) and Panel C; P gene (882 bp). Positive and negative controls are included.
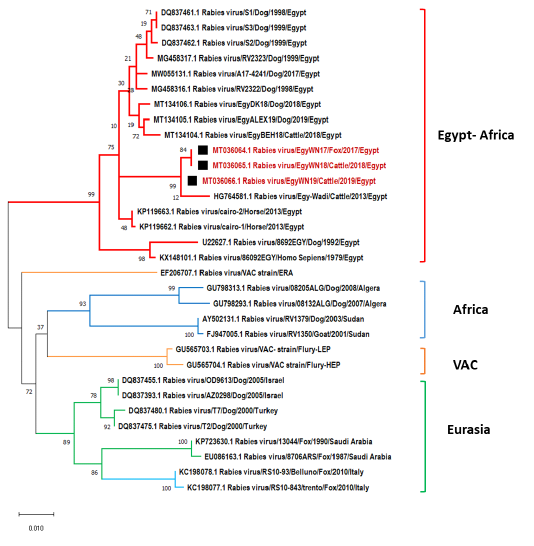
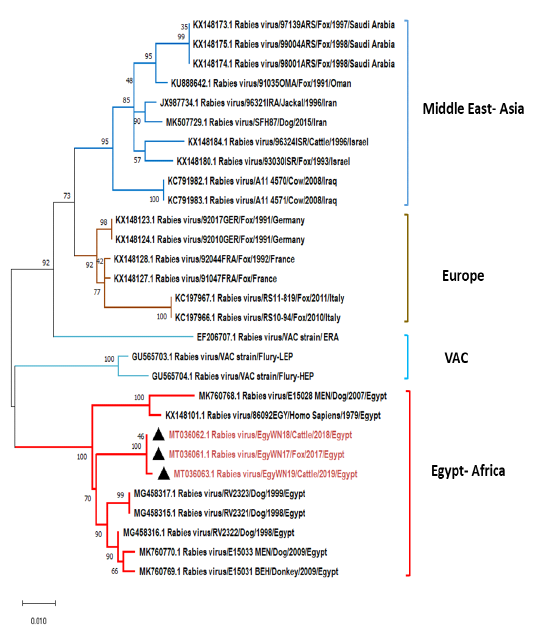
Phylogenetic tree using maximum likelihood method based on nucleoprotein (N) gene nucleotide sequences of our new RABV isolates from Elwadi- Elgedid (indicated by black squares) with other sequences of rabies viruses retrieved from the GenBank database. Numbers at the internal nodes represent the bootstrap probabilities (1000 replicates). The scale bar (0.01) means nucleotide changes or substitutions per site.
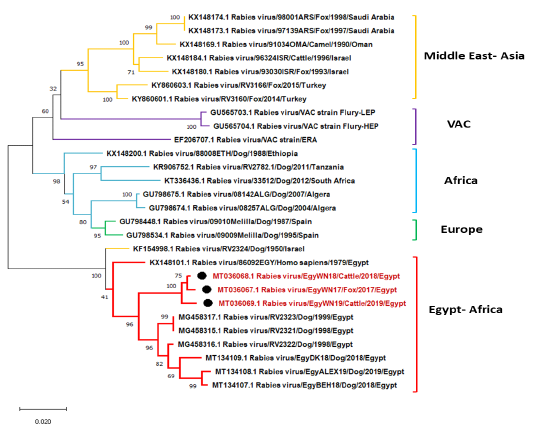
Phylogenetic tree using maximum likelihood method based on phosphoprotein (P) gene nucleotide sequences of our new RABV isolates from Elwadi- Elgedid (indicated by black circles) with other sequences of rabies viruses retrieved from the GenBank database. Numbers at the internal nodes represent the bootstrap probabilities (1000 replicates). The scale bar (0.02) means nucleotide changes or substitutions per site.
Phylogenetic tree using maximum likelihood method based on glycoprotein (G) gene nucleotide sequences of our new RABV isolates from Elwadi- Elgedid (indicated by black triangles) with other sequences of rabies viruses retrieved from the GenBank database. Numbers at the internal nodes represent the bootstrap probabilities (1000 replicates). The scale bar (0.01) means nucleotide changes or substitutions per site.
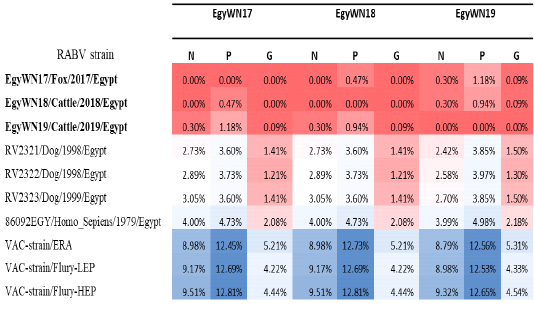
Pairwise distance percentages of the nucleotide sequences of N, P and G genes of the three new Egyptian isolates in relation to themselves and other Egyptian and vaccinal strains retrieved from the GenBank database. The highest related genes have a deep red color that converts to light red, light blue and deep blue with increasing distance


