Advances in Animal and Veterinary Sciences
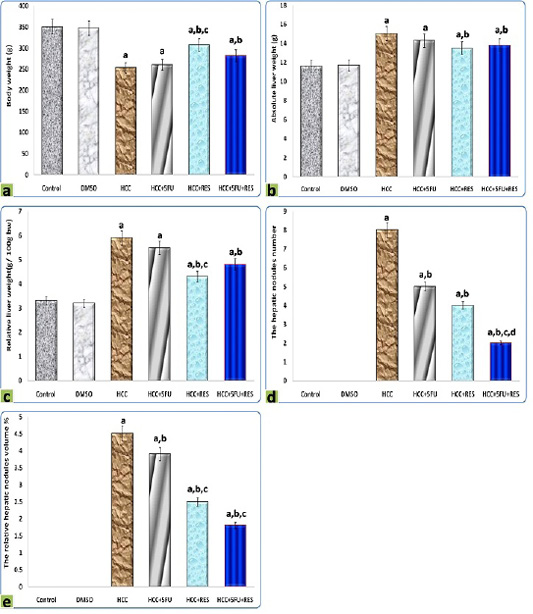
Graphic diagrams showing (a) body weight, (b) liver weight, (c) relative liver weight, (d) the hepatic nodules number, and (e) the relative hepatic nodules volumes of rats treated with different treatments. The significance by using one-way ANOVA followed by Tukey-HSD test for j multiple comparisons. a: Refers to significant change when compared to control rats; b: Refers to significant change when compared to HCC rats; c: Refers to significant change when compared to HCC+5-FU rats; d: Refers to significant change when compared to HCC+RES rats.
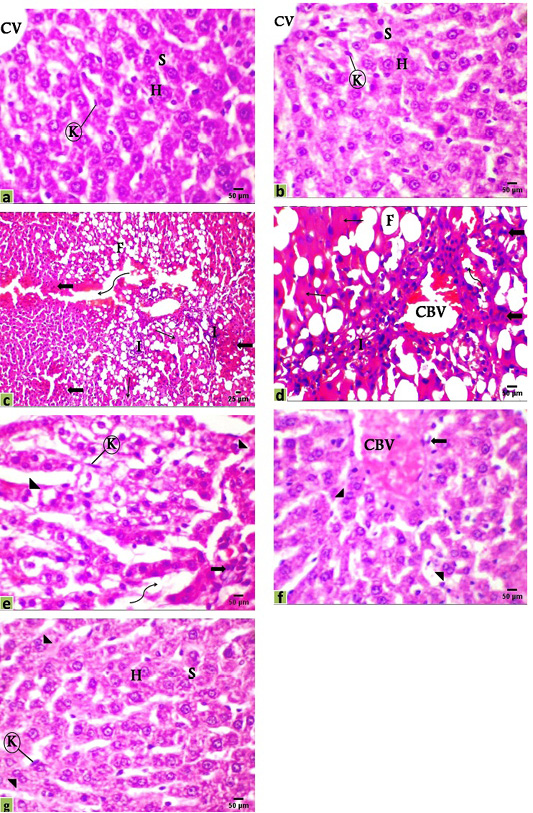
Photomicrographs of rats liver sections stained with H&E showing; (a) Control, (b) DMSO, (c and d) HCC model, (e) HCC+5-FU, (f) HCC+RES, and (g) HCC+5-FU+RES. Hepatocytes (H), sinusoid (S), Kupffer cell (K), central vein (CV), congested blood vessel (CBV), connective tissue infiltration with very fine fibroblastic cell proliferation (I), fat droplets (F), variable irregular shaped-dense and pale staining malignant cell (thick arrow), necrosis (thin arrow), edema in sinusoid (irregular arrow), binucleated cell (arrowhead), Scale bar = 50µm for all photo except (c) it’s scale bar = 25µm.
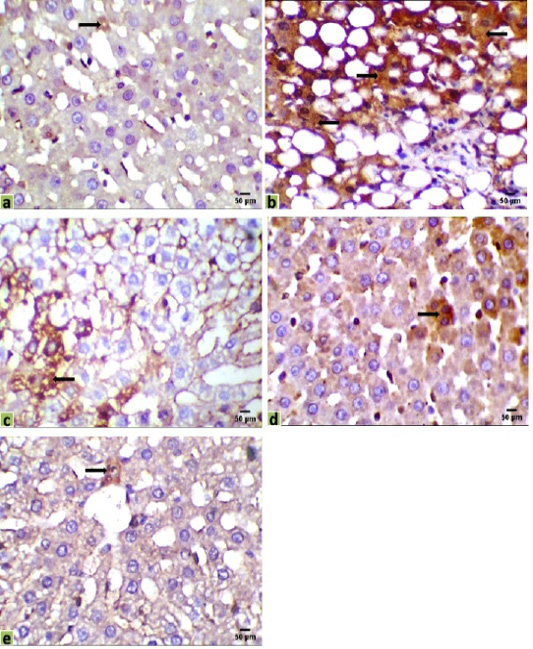
Immunohistochemical photomicrographs of rats liver sections showing immuno-expressions of Bax in various groups (arrows); (a) Control, (b) HCC model, (c) HCC+5-FU, (d) HCC+RES, and (e) HCC+5-FU+RES, Scale bar = 50µm.
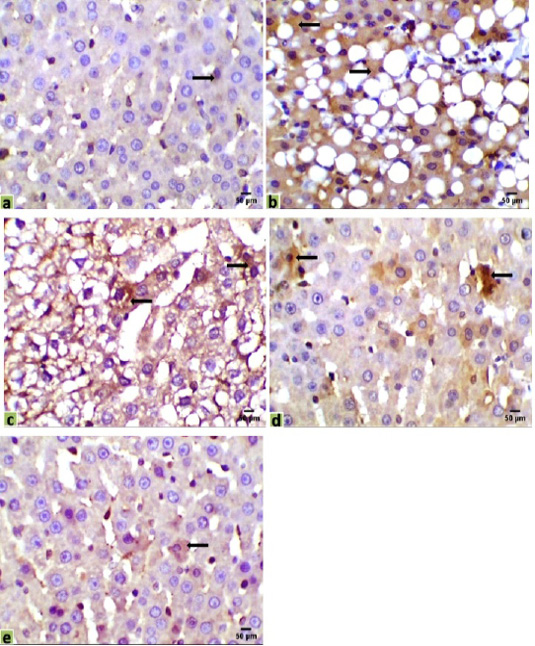
Immunohistochemical photomicrographs of rats liver sections showing CK18 expression in various groups (arrows); (a) untreated control, (b) HCC model, (c) HCC+5-FU, (d) HCC+RES, and (e) HCC+5-FU+RES, Scale bar = 50µm.
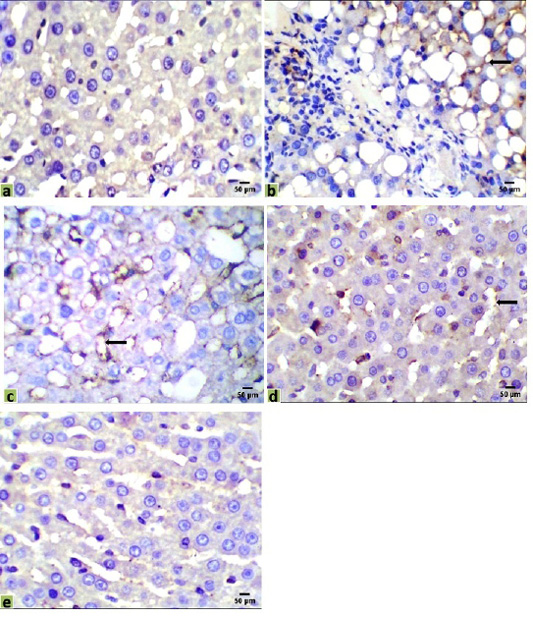
Immunohistochemical photomicrographs of rats liver sections showing CA19-9 expression in various groups (arrows); (a) untreated control, (b) HCC model, (c) HCC+5-FU, (d) HCC+RES, and (e) HCC+5-FU+RES, Scale bar = 50µm.
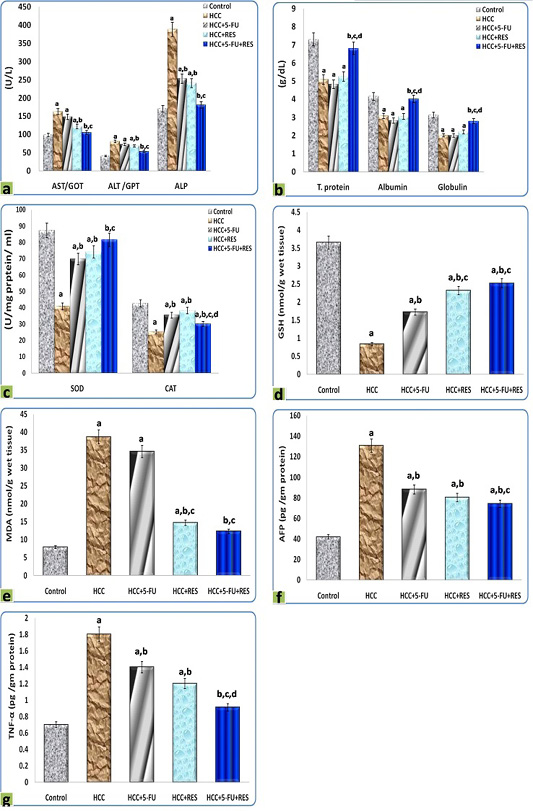
Graphic diagrams showing sera levels of (a) AST, ALT, and ALP, (b) absolute T. protein, albumin, and globulin in rats treated with different treatments, (c) SOD and CAT, (d) GSH, (e) MDA, (f) AFP, and (g) TNF-α of rats treated with different treatments. The significance by using one-way ANOVA followed by Tukey-HSD test for j multiple comparisons. a: Refers to significant change when compared to control rats; b: Refers to significant change when compared to HCC rats; c: Refers to significant change when compared to HCC+5-FU rats; d: Refers to significant change when compared to HCC+RES rats.


