Advances in Animal and Veterinary Sciences
Research Article
Adv. Anim. Vet. Sci. 9(11): 1765-1775
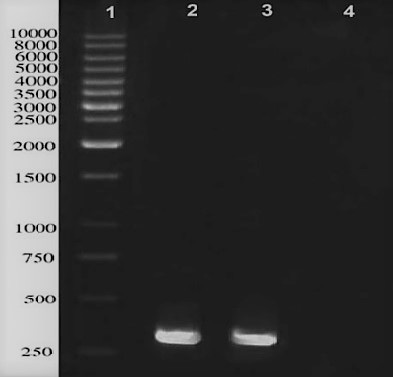
Figure 1
PCR amplification of ESAT-6 gene located in M. bovis genome; lane 1: 1kb DNA ladder, lane 2 and 3 represent a distinct band in approximately 290 bps, Lane 4 is negative control.
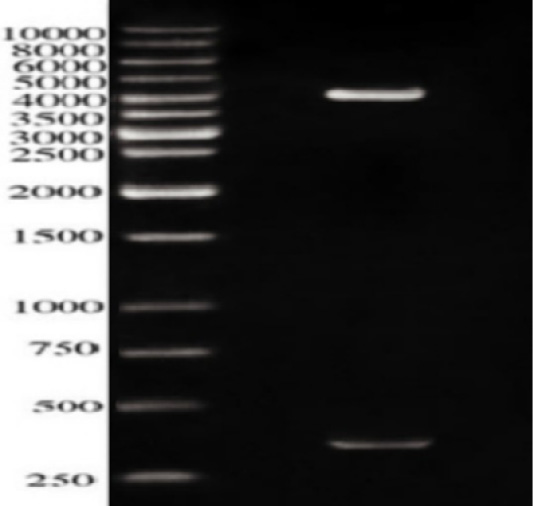
Figure 2
Restriction analysis of recombinant plasmid pQE30-ES against 10kbpDNA ladder; The Lower band is approximately 350 bps while the upper band is about 4000 b.
Figure 3
SDS-PAGE analysis of E. coli expressing ESAT-6. Lane M: protein molecular weight standard marker, the arrow pointed to the target protein bands which were visualized by Coomassie blue staining.
Figure 4
Western blot analysis of E. coli expressing ESAT-6. Lane M: protein molecular weight standard marker, the arrow pointed to the developed blot indicated the presence of target protein.


