Advances in Animal and Veterinary Sciences
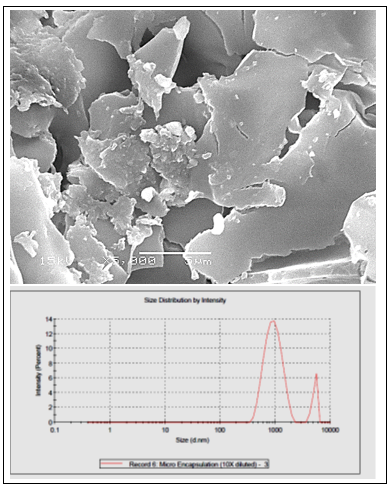
Scanning electron micrograph showing the appearance of microencapsulated AIT. Samples were examined on a cold stage at 5000X (A). Size Distribution by Intensity (B).
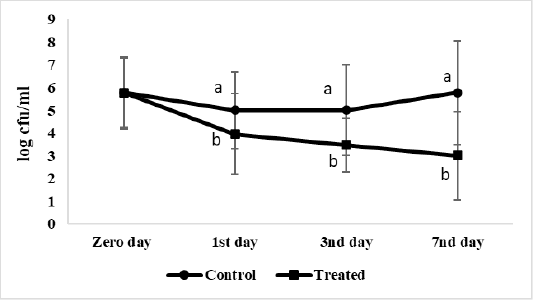
Salmonella Enteritidis viable count (log cfu/g) of ready to eat chicken nuggets treated with of microencapsulated AITC and control (untreated) at chilling preservation. Values are expressed as the mean ± SD. There are significant differences between points that have different letters on the same day of preservation.
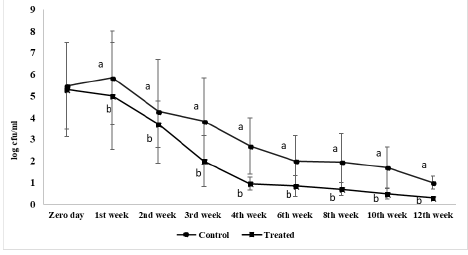
Salmonella Enteritidis viable count (log cfu/g) of ready to eat chicken nuggets treated with of microencapsulated AITC and control (untreated) at freezing preservation. Values are expressed as the mean ± SD. There are significant differences between points that have different letters on the same day of preservation.
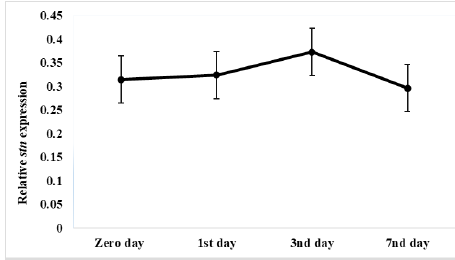
Relative stn gene expression of Salmonella Enteritidis in ready to eat chicken nuggets treated with of microencapsulated AITC at chilling preservation.
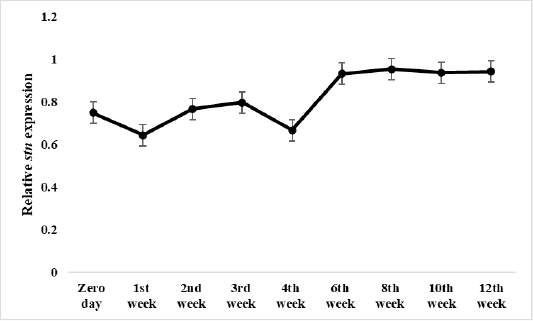
Relative stn gene expression of Salmonella Enteritidis in ready to eat chicken nuggets treated with of microencapsulated AITC at freezing preservation.
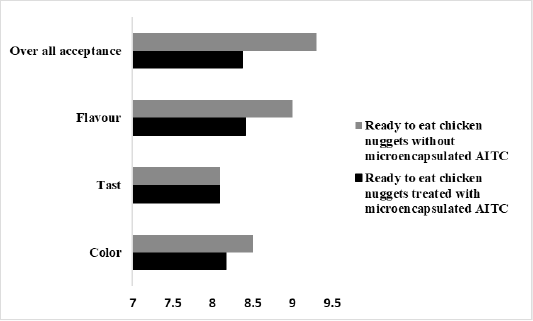
The average score of taste, color, flavor, and the overall acceptability of in ready to eat chicken nuggets without microencapsulated AITC and ready to eat chicken nuggets treated with of microencapsulated AITC.


