Advances in Animal and Veterinary Sciences
Research Article
Adv. Anim. Vet. Sci. 9(9): 1324-1330

Figure 1
Interleukin-10 levels in the plasma rats.
P0 (normal control); P1 (swimming exercise); P2 (swimming exercise and administered tempe extract of 150 mg/kg body weight/day)
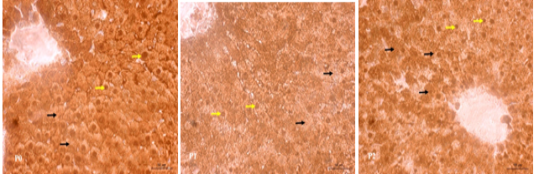
Figure 2
Immunohistochemical SOD staining in treated rat liver tissue.
The SOD profile in the cell nucleus (yellow arrow) and cytoplasm (black arrow) is brown indicating the positive reaction. P0 (normal control); P1 (swimming exercise); P2 (swimming exercise and given tempe extract of 150 mg/kg body weight /day).


