Advances in Animal and Veterinary Sciences
Research Article
Adv. Anim. Vet. Sci. 9(8): 1249-1258
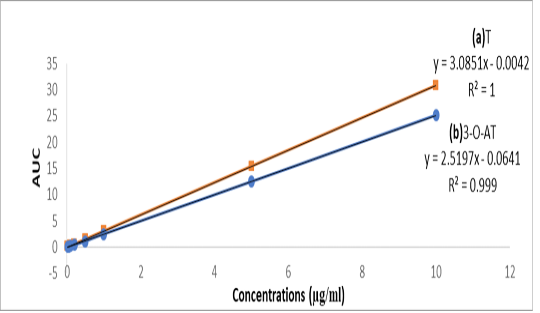
Figure 1a
Standard curve of (a)Tylvalosin and (b) 3-O-acetyltylosine (3-O-AT).
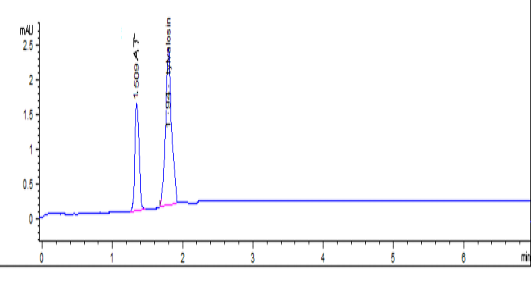
Figure 1b
Chromatogram of TVN and 3-O-acetyltylosine standard at concentration of 0.5 µg/ml
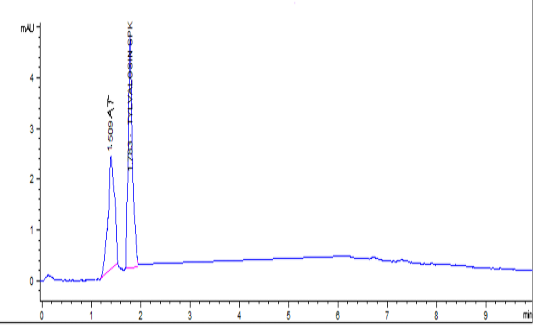
Figure 1c
Chromatogram of spiked blank tissue sample with TVN and 3-O-acetyltylosine (1 µg/g).
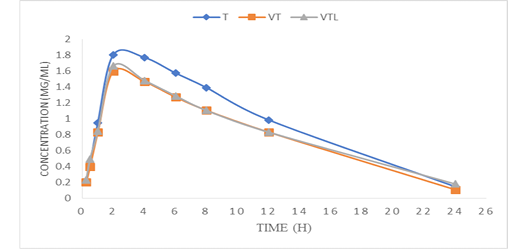
Figure 2
Mean plasma concentrations versus the time-course of sum of tylvalosin and its metabolite in serum of broilers after administration of tylvalosin 25 mg/kg b.wt in groups (T; TV &TVL) (Data represent mean ± SD values for 3 chickens).
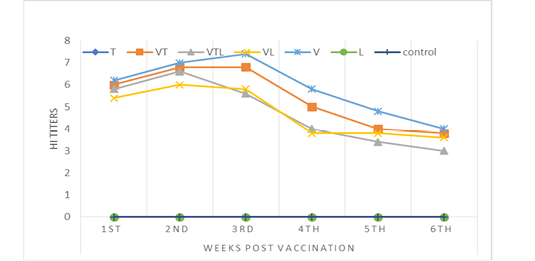
Figure 3
HI antibody chart for the tested groups after single NDV vaccination.
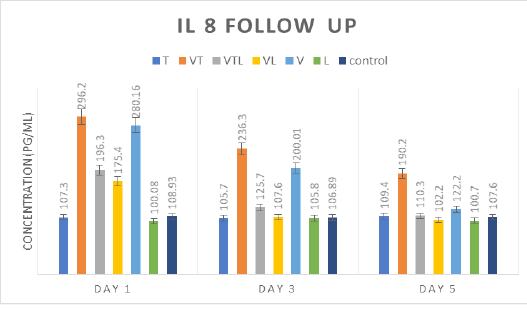
Figure 4
IL 8 level follow up in different tested groups by competitive immunoassay.


