Advances in Animal and Veterinary Sciences
Research Article
Advances in Animal and Veterinary Sciences 2 (2): 86 – 90Immunobiochemical Characterization of Native Leptin from Goat (Capra hircus): Serodiagnostic Potentiality Revealed
Sk. Sahanawaz Alam1, 2, Siddhartha Narayan Joardar1*, Ashis Kumar Panigrahi2
- Department of Veterinary Microbiology, West Bengal University of Animal and Fishery Sciences, 37, Kshudiram Bose Sarani, Post Office– Belgachia, Kolkata–700037, West Bengal, India
- Department of Zoology, University of Kalyani, Kalyani–741235, District-Nadia, West Bengal, India
*Corresponding author: joardar69@gmail.com
ARTICLE CITATION:
Alam S, Joardar SN, Panigrahi AK (2014). Immunobiochemical characterization of native leptin from goat (capra hircus): serodiagnostic potentiality revealed. Adv. Anim. Vet. Sci. 2 (2): 86 – 90.
Received: 2013–12–21, Revised: 2014–01–06, Accepted: 2014–01–07
The electronic version of this article is the complete one and can be found online at
(
http://dx.doi.org/10.14737/journal.aavs/2014/2.2.86.90
)
which permits unrestricted use, distribution, and reproduction in any medium, provided the original work is properly cited
ABSTRACT
The leptin, a cytokine–like adipose tissue–derived protein hormone, is one of the best physiological markers for body weight, food intake, energy expenditure and reproduction. Information regarding molecular characteristics of leptin protein in different animal species is scarce. With the aim of characterizing the leptin protein of Black Bengal goat at molecular level, the present study was designed to isolate the goat leptin protein from its adipocytes. In the present study, chemical treatment and ultra–sonication techniques were used for isolating leptin protein from goat adipose tissue. Purification of the protein was attempted using affinity column chromatography. The molecular, biophysical and serological characterization of leptin protein from Black Bengal goat were performed by 2D–gel electrophoresis, SDS–PAGE, MALDI–TOF mass spectroscopy and Western blotting. The 2D–gel electrophoresis analysis revealed that goat leptin possessed isoelectric point (P.I.) of 5.8 and molecular mass of 16 kDa. Western blot analysis revealed that the Black Bengal goat adipocytes possessed the seroreactive leptin protein of 16 kDa. MALDI–TOF mass spectroscopy and peptide analysis further confirmed the molecular mass of goat leptin to be of 15948.72 Da. The serodiagnostic potential of affinity purified protein was revealed while assessing its serological responses by dip–stick ELISA using anti–leptin antibodies that might be exploited while preparing of sero–diagnostic tool(s) for goat leptin detection from unknown (test) samples.
INTRODUCTION
Leptin is a 16 kDa adipocyte–derived cytokine like protein hormone and is composed of 167 amino acid residues produced mainly by adipose tissue and, at a lower extent, by other organs such as stomach, placenta, muscle, immune cells and mammary gland (Ahima and Filer, 2000). It has been discovered in rodents where it is a synthesized primarily in adipose tissue and released into the bloodstream (Zhang et al., 1994). The role of leptin as a lipostatic signal regulating whole body energy metabolism makes it one of the best physiological markers for body weight (BW), food intake, energy expenditure and reproduction. The mRNA levels for circulating leptin and adipose tissue leptin mRNA levels are correlated with BW, feed intake, nutritional status, and adipose tissue mass in human and animals (McGregor et al., 1996; Cohen et al., 1996). The Black Bengal goat, Capra hircus, is one of the most priced meat– purpose breed of West Bengal state (India) and is a symbol for world biodiversity conservation. A slow breeding rate and low birth weight are important factors in the slow population recovery of the Bengal breed of goat. However, the actual cause of this slow breeding rate and low birth weight has not yet been identified. Although extensive studies have been done on leptin of human and laboratory animals, information in domesticated animals is scarce. With the aim of characterizing the goat leptin at molecular level, the present study was designed to isolate and purify goat leptin protein with its subsequent molecular and serological characterization.
MATERIALS AND METHODS
Isolation of Goat Leptin
Adipose tissues were collected from goat of Black Bengal breed (Capra hircus) from local market and kept in deep freezer (–200 C) for future use. Total adipose tissue was thawed in 0.4 ml of cold urea/thiourea buffer (7M urea, 2M thiourea, 4% CHAPS, 45mM Tris, pH 7.4, 60mM DTT) and complete protease inhibitors (one tablet/20 ml, Roche, Barcelona, Spain) supplemented with 0.1 mM NaCl. Adipocytes were mechanically disrupted and briefly sonicated (Hielscher Ultrasonics GmBH, Germany). Samples were adjusted to 900μl with lysis buffer (20 mM Tris, pH 7.4; 100 mM Nacl; 1% Triton and protease inhibitors) and incubated for 15 min at 35ºC. After cooling on ice (10 min), 100μl of 0.1M Tris, pH 7, and 50 mM MgCl2 were added to the homogenate, which were then incubated with DNase–1 (30 U Sigma) on ice for 10 minutes. The homogenate was centrifuged (15 min, 10000 g, 4ºC) and the aqueous phase between the upper lipid phase and the lower cellular debris phase was collected. Finally the extract was separated by chloroform/methanol precipitation and dissolved in phosphate buffer solution (pH –7.4). The total protein concentration was determined using Lowry’s method (1951).
Isoelectric Focusing and Two Dimensional–Polyacrylamide Gel Electrophoresis (2D–Page)
Isoelectric focusing and 2D–PAGE of proteins obtained from chemically treated adipocyte tissue was performed as per Peinado et al. (2010). Adipocyte protein was treated with 0.2 ml rehydration buffer (8 M urea, 2% CHAPS, 50 mM DTT, 0.2% ampholytes pH 3–10 and 0.002% bromophenol blue). Electrophoresis was carried out following the manufacturer’s protocol (Bio–Rad Laboratories, USA). Briefly, non linear pH 3–10 IPG strip was rehydrated with 0.25 ml rehydration buffer containing 0.05 ml sample overnight at 25ºC and then subjected to isoelectric focusing. The strip was then equilibrated with reducing buffer (6 M urea, 2% SDS, 30% glycerol, 50 mM Tris–HCl and 25 mM DTT) followed by alkylation buffer (6 M urea, 2% SDS, 30% glycerol, 50 mM Tris–HCl and 135 mM IAA). The strip was then placed on 12.5% SDS polyacrylamide gel using 1% agarose in SDS–PAGE running buffer. After electrophoresis gels were stained by SYPRO Rubi dye (BioRad, USA). The stained gel was washed with washing solution (10% methanol, 7% glacial acetic acid) and the final washing was done with Milli–Q water for 10 min according to manufacturer’s instructions. The gel was scanned with the help of Fuji scanner in the fluorescence mode to visualize the stained. The spot volume was measured and reported as percent volume of the spot (normalized volume of spots, % volume) in relation to the sum of all detected spot and this provided normalized spot volume. The change in percentage volume is basis on the detection of differential protein identification.
SDS–PAGE
Crude and affinity purified leptin proteins were analyzed by sodium dodecyl sulphate polyacrylamide electrophoresis (SDS–PAGE) as described by (Laemmli et al., 1970) using 12.5% polyacrylamide gel in a vertical mini slab gel electrophoretic apparatus (Attao, Japan). The samples were mixed with sample buffer in a proportion of 1:1 and subsequently the solution was heated at 100ºC for 2 min. The amount of protein applied was 50μg per track. Proteins were run at 18 mA for 150 min. The bands were visualized by staining with coomassie brilliant blue R–250 and with monochromatic silver staining (Shevchenko et al., 1996). Standard molecular weight marker (PMW–M, Genei, India) was run parallel along with sample proteins to determine the relative molecular weights of the polypeptides.
Purification of Goat Leptin by Affinity Chromatography
Leptin protein was purified by affinity chromatography kit (Genei, India) having Con–A attached with carbon background (cellulose). In the first step, Concanavalin–A agarose column was prepared in sodium acetate buffer as per manufacture’s instruction. Then the sample protein was charged on the column and the unbound fraction was eluted with sodium acetate buffer. In next step, bound fraction was eluted with the help elution buffer. Fractions under each region were pooled and dialyzed against distilled water at 4ºC. Proteins were concentrated by sucrose, sterilized through a membrane filter (0.22 μ), and stored at –20ºC and estimated by Lowry’s method (1951).
Western Blot Analysis
Affinity purified leptin protein fraction was separated on a 12.5% SDS–PAGE, and electro transferred onto NCM membrane on a semi dry blotting unit (Atto, Japan) as per (Towbin et al., 1979) with some modifications. The blotted proteins were subjected to immunoblot analysis with commercially available anti–leptin goat polyclonal antibodies (ProSci, Germany) and anti–goat horse radish peroxidase antibodies (Genei, India). Standard molecular weight marker (Fermentas) was run parallel along with sample proteins to determine the relative molecular weights of the polypeptides.
MALDI–TOF Mass Spectrometry
The molecular mass of affinity–purified fraction was determined by Voyager DE ProTM mass spectrometer equipped with 337 nm N2 laser (Applied Biosystems, USA) as per (Mandal et al., 2009). Purified protein (2 μl) was mixed with MALDI matrix, synapinic acid (8 μl), then 2 μl of mixture solution was spotted onto the MALDI 100 well stainless steel sample plate and allowed to air dry (for 5 hr) prior to the MALDI analysis. The spectra were recorded in the positive ion linear mode in accelerating voltage 20 kV. Peptide mono–isotopic mass was obtained in linear mode with external calibration. It was performed using calibration mixture 1 (Applied Biosystems, USA) having Arg1–Bradykinin (m/z, 904.468), angiotensin I (m/z, 1296.685), Glu1–fibrinopeptide B (m/z, 1570.677) and ACTH (18–39) (m/z, 2465.199). Reproducibility of the spectrum was checked 5 times from separately spotted samples.
Enzyme Linked Immunosorbent Assay (ELISA)
Dip–stick ELISA was performed with the affinity purified fraction following the procedure of Jiahao et al. (1997) with some modifications encompassing incubation time, dilution of conjugates, composition of washing buffer and substrate solution. Coating of three sticks was done by affinity purified protein @ 2μg/stick. After blocking and subsequent washing of the sticks, anti–leptin antibody, normal chicken serum and PBS were added in the three sticks, respectively. In the next step, after proper washing, anti–chicken HRPO conjugate was added to the sticks. The colour development step was carried out by dipping the sticks into substrate solution (40 ml H2O2, 0.025 gm diaminobenzydine in 10 ml Tris HCl, pH 7.5).
RESULTS
Leptin Protein Concentration Estimation
The concentration of the crude protein from adipose tissue was estimated as– 9.5 mg/ml and affinity purified leptin protein concentration was found to be 0.13 mg/ml
Isoelectric Focusing and 2D–PAGE
The 2D–PAGE of crude adipocyte protein after chemical treatment by urea/thiourea buffer showed several proteins in the range of molecular weight of 10–225 kDa. The proteins were mainly present in 4–8 pI range. In goat, proteins of low molecular weight were less abundant. Proteins were mainly visible in the range of 10–110 kDa range (Figure 1).
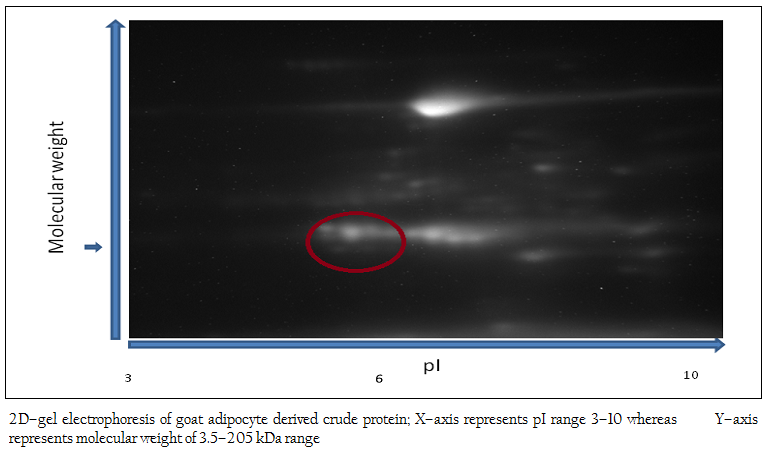
Figure 1: 2D–gel electrophoresis of goat adipocyte derived crude protein; X–axis represents pI range 3–10 whereas Y–axis represents molecular weight of 3.5–205 kDa range
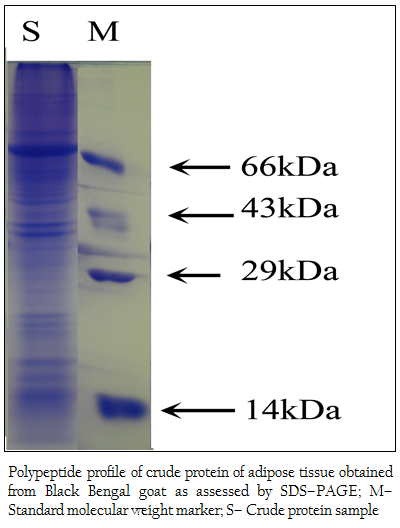
Figure 2: Polypeptide profile of crude protein of adipose tissue obtained from Black Bengal goat as assessed by SDS–PAGE; M– Standard molecular weight marker; S– Crude protein sample
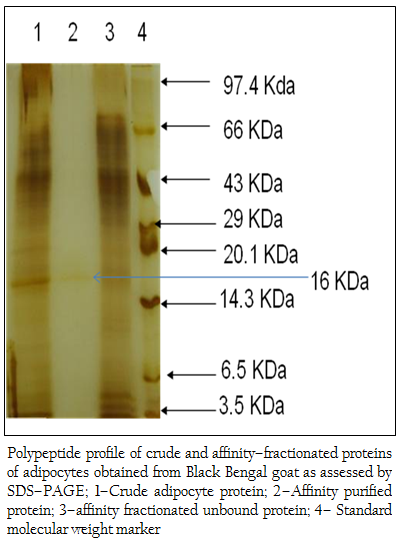
Figure 3: Polypeptide profile of crude and affinity–fractionated proteins of adipocytes obtained from Black Bengal goat as assessed by SDS–PAGE; 1–Crude adipocyte protein; 2–Affinity purified protein; 3–affinity fractionated unbound protein; 4– Standard molecular weight marker
SDS– PAGE
When the crude protein obtained from adipose tissue was subjected to SDS–PAGE analysis, 37 (thirty seven) polypeptides in the molecular weight ranging from 14– to 100 kDa were obtained (Figure 2). The bound affinity purified fraction yielded only one polypeptide and the crude and unbound fraction contained several polypeptides in the molecular weight range from 3.5– to 100 kDa (Figure 3).
Western Blotting
When Western blotting analysis was performed with the crude and affinity purified protein using anti–leptin monoclonal antibodies, a band corresponding to 16 kDa was observed in both cases indicating the presence of 16 kDa leptin protein in the crude preparation and affinity purified protein (Figure 4 a, b).
MALDI–TOF Mass Spectrometry
The affinity purified protein fraction when subjected to MALDI–TOF mass spectrometry to determine the molecular mass more perfectly, it revealed as 15948.72 Da (Figure 5).
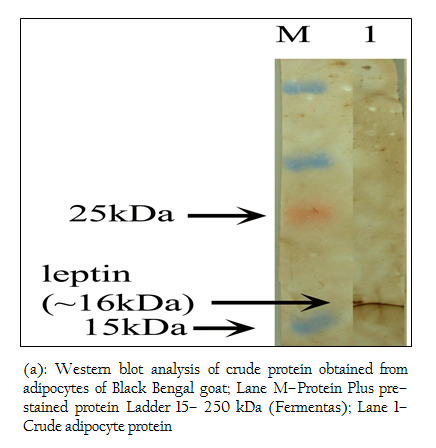
Figure 4: (a): Western blot analysis of crude protein obtained from adipocytes of Black Bengal goat; Lane M–Protein Plus pre–stained protein Ladder 15– 250 kDa (Fermentas); Lane 1– Crude adipocyte protein
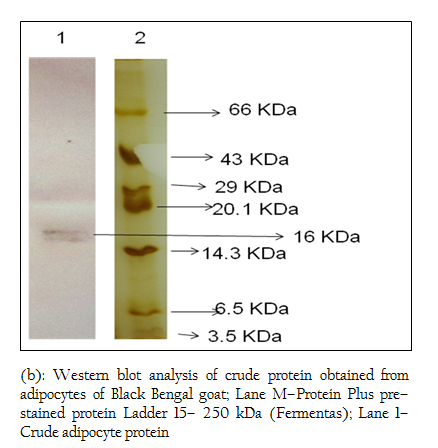
Figure 4: (b): Western blot analysis of crude protein obtained from adipocytes of Black Bengal goat; Lane M–Protein Plus pre–stained protein Ladder 15– 250 kDa (Fermentas); Lane 1– Crude adipocyte protein
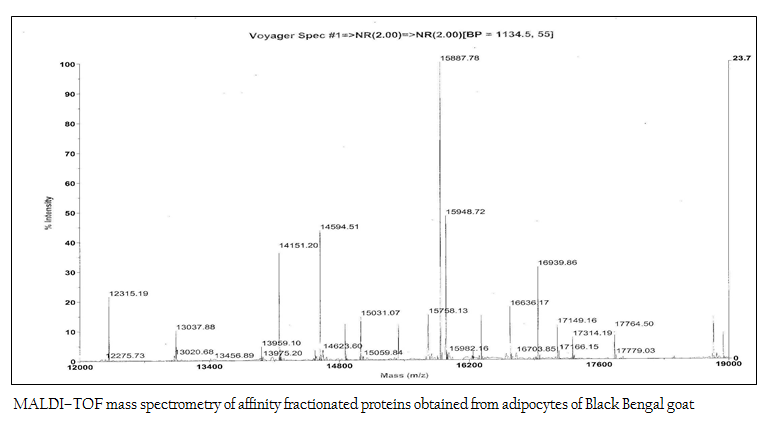
Figure 5: MALDI–TOF mass spectrometry of affinity fractionated proteins obtained from adipocytes of Black Bengal goat
ELISA
Out of the three dip–sticks used, the first stick showed highest seroreactivity (Figure 6) indicating affinity purified protein contained leptin protein as the coated purified protein would react positively with anti–leptin antibody used in the study. The second and third sticks served as negative controls.
DISCUSSION
Leptin has been characterized as a protein hormone which in mammals is synthesized and secreted primarily by adipocytes in response to increased energy storage in adipose tissue (Zhang et al., 1994; Halaas et al., 1995). White adipose tissue is the key site of leptin production in mammals (Cinti et al., 1997). In the present study, goat adipocyte tissue was considered for leptin protein isolation.
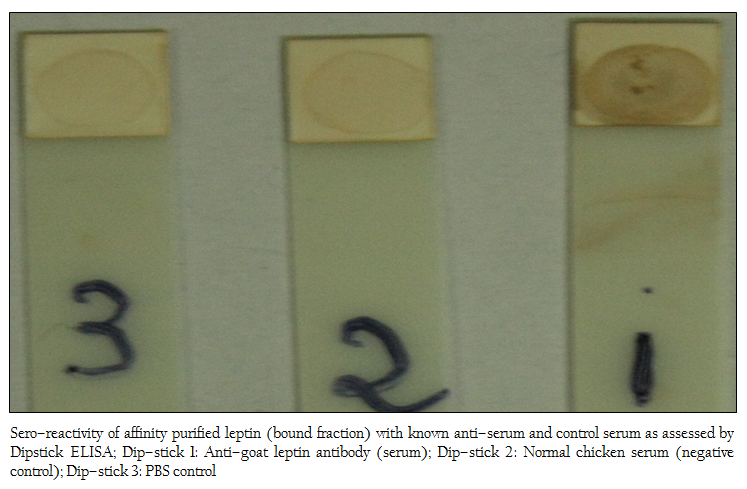
Figure 6: Sero–reactivity of affinity purified leptin (bound fraction) with known anti–serum and control serum as assessed by Dipstick ELISA; Dip–stick 1: Anti–goat leptin antibody (serum); Dip–stick 2: Normal chicken serum (negative control); Dip–stick 3: PBS control
After chemical treatment and sonication, crude proteins were obtained from adipocytes. Then, the crude proteins were subjected to SDS–PAGE and 2D–gel electrophoresis for protein profile. The molecular weight and isoelectric point (pI) are the two important parameters generally used for identification of desired protein (Peinado et al, 2010). In the present work, the polypeptide profile of the crude proteins of adipose tissue origin contained low and high molecular weight polypeptides in the range of 14 kDa to 100 kDa including proteins of 16–18 kDa. The 2D–gel electrophoresis of crude protein showed the presence of several proteins with various sizes and isoelectric points (pI) in the range of 5.2–6.8 and molecular weight 15–20 kDa. As pI of leptin protein of mammals is 5.8 (DiMarchi et al., 1998), the possibility of presence of leptin protein in this preparation was inevitable. In the next step, affinity purification of the crude protein preparation was done successfully using ConA–celllulose column. The affinity purified protein revealed a single band of molecular mass 16 kDa as assessed by SDS–PAGE. The present work corroborates with the previous work of Cohen and co–workers where the molecular mass of affinity purified recombinant human leptin protein was estimated as approximately 16000 Da by SDS–PAGE while the molecular mass of endogenous human leptin was reported as 16,026±9 Da by MALDI mass technique (Cohen et al., 1996). The molecular weight of leptin protein was reported earlier within the range of 16–18 kDa (Takahashi et al., 2002, Taniguchi et al., 2002). Subsequently, western blot analysis revealed that Black Bengal goat adipocytes contained the leptin (16 kDa) protein both in crude and affinity purified bound fraction having seroreactive property. Earlier, western blot analysis with leptin–specific antibody detected a protein with a molecular mass of approximately 15–16 kDa in dunlin liver and adipose tissue (Kochan et al., 2006). The actual molecular mass of leptin protein of Black Bengal goat was carried out using mass spectroscopic analysis and the molecular weight obtained was 15948.72 Da. In a previous study, gel pieces containing the leptin protein (16–kDa) of giant panda were excised and their peptide mass fingerprints were obtained and analyzed by MALDI TOF–TOF–MS. The mass of the mature protein without the signal peptides was detected as 16.8 kDa (Xu et al., 2010). The sero–reactivity of affinity purified fraction was confirmed by dipstick ELISA with the help of anti–goat leptin antibodies. Moreover, this test revealed its potentiality in detecting leptin protein in clinical (suspected/unknown) samples and thus explored the possibility of replacing other prevalent serodiagnostic assay viz. radioimmunoassay. In conclusion, the native leptin of goat (Capra hircus) can be purified using ConA column. Moreover, it possesses a molecular mass of 15948.72 Da and sero–reactive property that might be exploited while preparing of sero–diagnostic tool(s) for its detection from unknown (test) samples.
ACKNOWLEDGEMENTS
The work was supported by the grant (BT/01/NE/TBP/2010) of Twinning Programm for North–East, sponsored by The Department of Biotechnology, Government of India, New Delhi. We acknowledge DST Purse, University of Kalyani for some financial assistance. Authors are thankful to the Vice Chancellor, West Bengal University of Animal and Fishery Sciences, Kolkata and the Director, Indian Institute of Technology, Kharagpur for providing necessary infrastructure ficilities.
REFERENCES
Ahima RS, Filer JS (2000). Leptin and the neuroendocrinology of fasting. Annu. Rev. Physiol. 62: 413 – 437.
http://dx.doi.org/10.1146/annurev.physiol.62.1.413
PMid:10845097
Cinti S, Frederich RC, Zingaretti MC, De Matteis R, Flier JS, Lowell BB (1997). Immunohistochemical localization of leptin uncoupling protein in white and brown tissue. Endocrinol. 138: 797 – 804.
http://dx.doi.org/10.1210/endo.138.2.4908
http://dx.doi.org/10.1210/en.138.2.797
PMid:9003017
Cohen S L, Halass JL, Friedman JM, Chait BT, Bennett L, Chang D, Hecht R, Collins F (1996) . Human leptin characterization. Nature. 382: 15 – 20.
http://dx.doi.org/10.1038/382589a0
PMid:8757126
DiMarchi RD, Hermeling RN, Hoffmann JA (1998). Anti–obesity proteins. US Patent 5,7,19,266. El-Lilly & Co.
Halaas JL, Gajiwala KS, Maffei M, Cohen SL, Friedma JM (1995). Weight reducing effects of the plasma protein encoded by the obese gene. Science 269: 543 – 546.
http://dx.doi.org/10.1126/science.7624777
PMid:7624777
Jiahao M, Xueqin L, Zhenyin W, Zhenguo Y, Wendong W (1997). Rapid detection of motile Aeromonas species in fish by Dot ELISA. J. Dalian Fish. College 12: 72 – 78.
Peinado JR, Yolanda, Jimenez–Gomez Y, Pulido M, Ortega–Bellido M,Diaz–Lopez C, Padillo JF, Lopez–Miranda J, Vazquez–Martı’nez R, Malagon M (2010). The stromal–vascular fraction of adipose tissue contributes to major differences between subcutaneous and visceral fat depots. Proteomics 10: 3356 – 3366
http://dx.doi.org/10.1002/pmic.201000350
PMid:20706982
Kochan Z, Karbowska J, Meissner W (2006). Leptin is synthesized in the liver and adipose tissue of the dunlin (Calidris alpina). Gen. Comp. Endocrinol. 148: 336 – 339.
http://dx.doi.org/10.1016/j.ygcen.2006.04.004
PMid:16730725
Laemmli UK (1970). Cleavage of structural proteins during assembly of the head of bacteriphage T4. Nature 227: 680 – 685.
http://dx.doi.org/10.1038/227680a0
PMid:5432063
Lowry OH, Rosenbrough NJ, Farr AL, Randall RJ (1951). Protein measurement with Folin–phenol reagent. J. Biol. Chem. 193: 265 – 275.
PMid:14907713
Mandal SM, Dey S, Mandal M, Neto SM, Franco OL (2009). Identification and structural insights of three novel antimicrobial peptides isolated from green coconut water. Peptides 30: 633 – 637.
http://dx.doi.org/10.1016/j.peptides.2008.12.001
PMid:19111587
McGregor GP, Desaga JF, Ehlenz K, Fischer A, Heese F, Hegele A, Lammer C, Peiser C, Lang RE (1996). Radio immunological measurement of leptin in plasma of obese and diabetic human subjects. Endocrinol. 137: 1501 –1504
http://dx.doi.org/10.1210/endo.137.4.8625930
http://dx.doi.org/10.1210/en.137.4.1501
Shevchenko A, Wilm M, Vorm O, Mann M (1996). Mass spectrometric sequencing of proteins from silver–stained polyacrylamide gels. Anal Chem. 68: 850 – 858.
http://dx.doi.org/10.1021/ac950914h
PMid:8779443
Takahashi N, Patel HR, Qi Y, Dushay J, Ahima RS (2002) Divergent effects of leptin in mice susceptible or resistant to obesity. Horm. Metabol. Res. 34: 691 – 697.
http://dx.doi.org/10.1055/s-2002-38251
PMid:12660884
Taniguchi Y, Itoh T, Yamada T, Sasaki Y (2002). Genomic structure and promoter analysis of the bovine leptin gene. IUBMB Life. 53(2): 131 –135.
http://dx.doi.org/10.1080/15216540211465
PMid:12049196
Xu Q, Xinming Z, Ning H, Jianxin S, Rong H, Zhihe Z, Hongwu B, Muyuan Z (2010). Characterization and Expression of Ailuropoda melanoleuca Leptin (ob gene). Zoo. Sci. 27: 41 – 46
http://dx.doi.org/10.2108/zsj.27.41
PMid:20064007
Zhang Y, Proenca R, Maffei M, Barone M, Leopoid L, Friedman JM (1994). Positional cloning of the mouse obese gene and its human homologue. Nature 372: 425 – 432.
http://dx.doi.org/10.1038/372425a0
PMid:7984236


