Advances in Animal and Veterinary Sciences
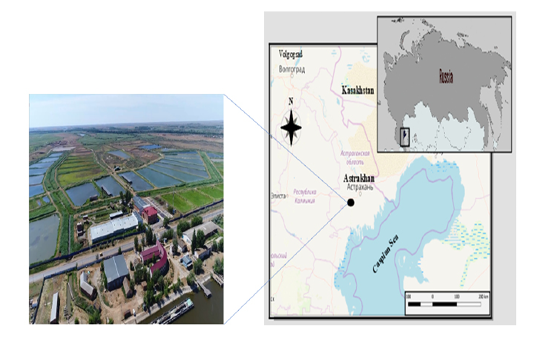
Map of Scientific and Experimental Base of (Caspnirkh) Fsbb – (Bios) Center. Astrakhan, Southern Russian Federation. Http://Www.kaspnirh.ru
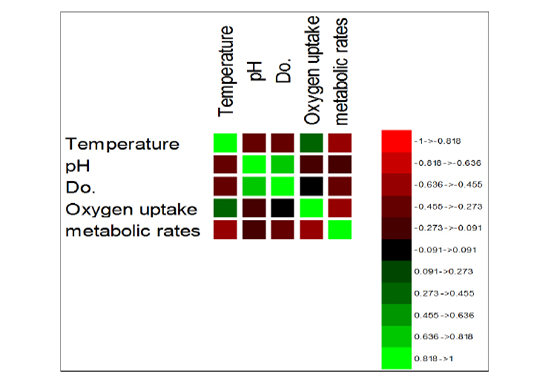
Image of the correlation matrix.
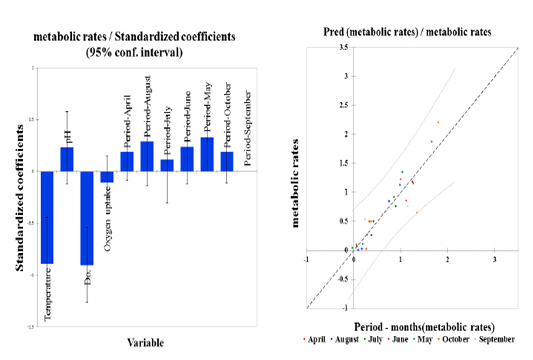
Standardized coefficients (Metabolic rate & stress factors, variables) for season period-months expressed as a change in the degrees of standard deviations between four variables and the predictor (Pred, seasonal period-months to metabolic rates) with a confidence interval (95%).
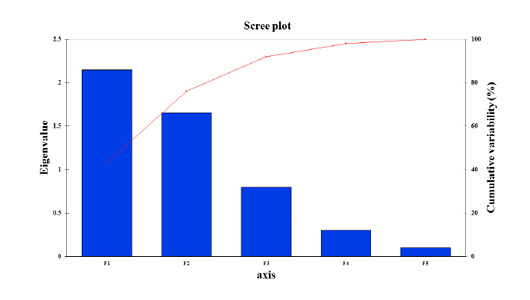
Scree plot of principal component analysis of paddlefish stress factors with the response (Metabolic rates) over the season period between eigenvalue and principal components or factors. The Scree plot illustrates the high percentage of cumulative variance associated with each PC or F obtained by drawing a graph between eigenvalues and factor numbers for the scaling of the x and y-axes.
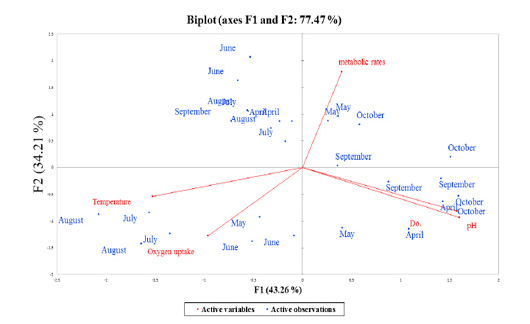
Overall principles component analysis (PCA) bi-plot of scores and loading for the contribution of the active observations (7-months period represented as blue-points) to the parameters (red-color coded to their active variables), collected during production season 2018, the period from April to October.
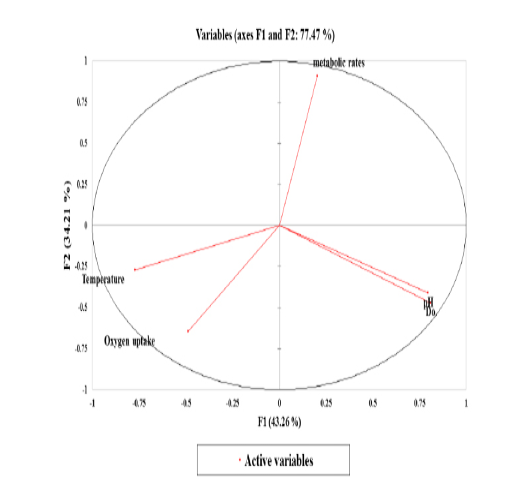
The correlation circle or variables chart shows the correlations between the Principal Components (PCs; PC1 and PC2) and the variables.
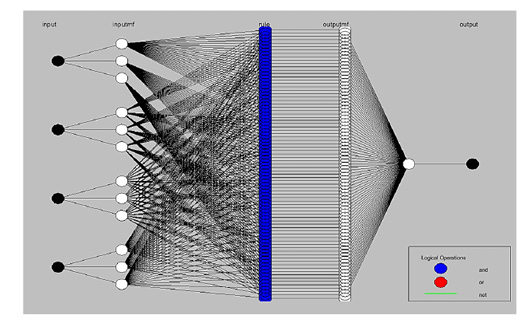
Model structure of Adaptive Neuro-Fuzzy Inference System (ANFIS) designer. ANFIS can be formed by white nodes, which typically originate from each different aquatic stress factor (black nodes), using three linguistic words. This mapping properly provides interaction pathways among initiated input factors to affected and transmuted between (81- membership function rules) in neural network blue nodes emitted from four inputs up to terminate in metabolic rate black node, before that is all ending nodes aggregate into final output crisp.
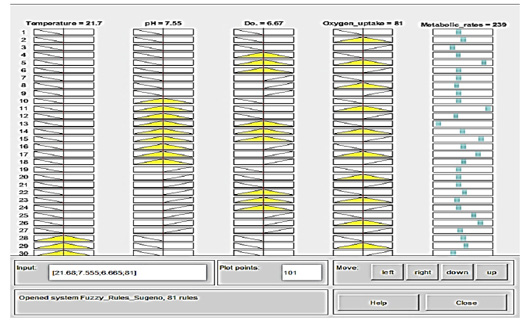
Prediction of Crisp data is collected manually via moving the vertical red-axis for each variable of 4 variables within linguistic ranges (yellow-color), displaying the effect of deflection on the output dataset values (blue-color) expressed in metabolic rates. Membership function rule viewer in a fuzzy logic system from the left-to-right side: If temperature 21.7 °C; pH 7.55; dissolve oxygen 6.67; oxygen uptake 81, then the metabolic rate will be 239 that means is very high.
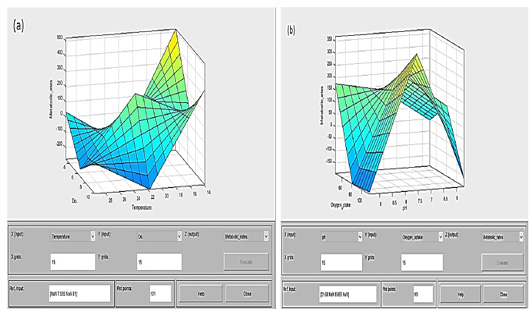
Surface 3D-graph can examine by degrees of colors and values for output surface (metabolic rate, yellow low-values to green high-values) of a fuzzy inference system (FIS) for two inputs parameters (4 stress factors, dark blue low-values to light green high-values). (a) Surface viewers conclude that the metabolic rate percentage increased from 300 to 500, when the dissolved oxygen (dependent variable) decreases to 4 ppm, and temperature (independent variable) reduced below 25 °C to reach at 14 °C when it goes up this considerable percentage. (b) The metabolic rate percentage increases substantially when oxygen uptake (dependent variable) increases up to 100 mg/h/Kg, and pH (independent variable) holds an average value of about 7.5.


