Advances in Animal and Veterinary Sciences
Research Article
Adv. Anim. Vet. Sci. 9(5): 766-772
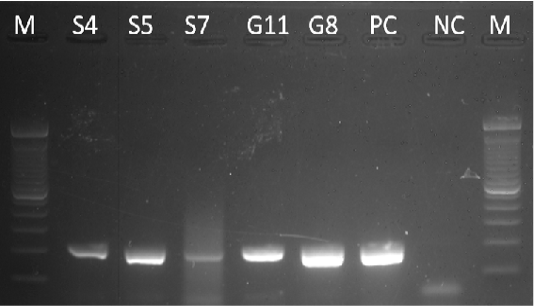
Figure 1
Gel analysis using the Beta-actin gene. M – 100 bp DNA ladder, PC – Positive Control, NC – Negative Control
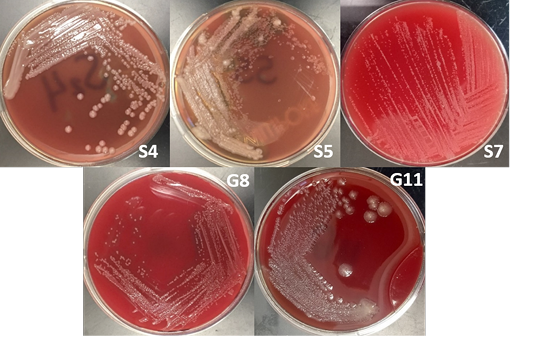
Figure 2
The Growth of bacterial isolate in blood agar.
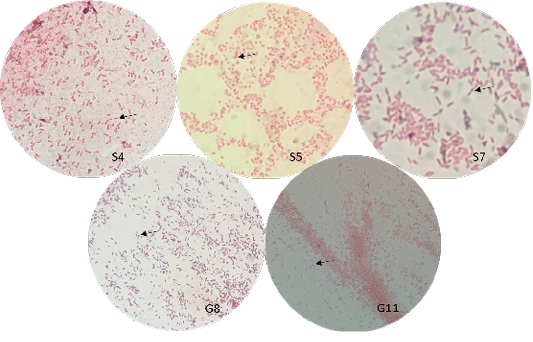
Figure 3
Gram-staining of bacterial isolates observed under oil immersion at 1000x.
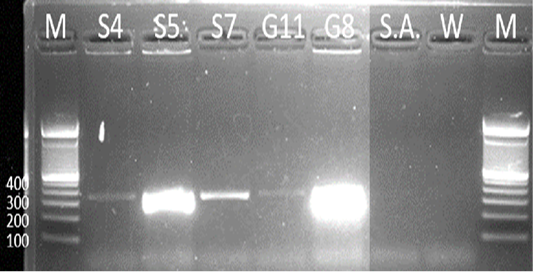
Figure 4
Gel analysis using Burkholderia-specific 16S rDNA. M - GeneRuler1kb plus DNA ladder. S.A – Staphylococcus aureus. W – Double Distilled Water
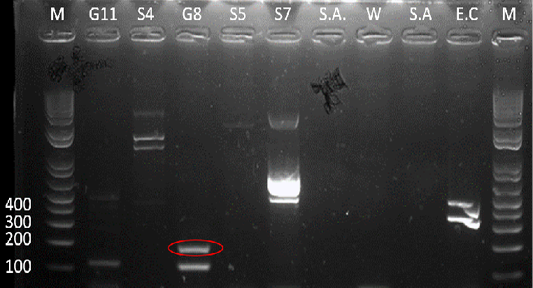
Figure 5
Gel analysis using Tat-domain encoding gene Burkholderia sp. primer. M - GeneRuler1kb plus DNA ladder. W – Double Distilled Water. S.A. – Staphyloccocus aureus. E.C. – Escherichia coli.
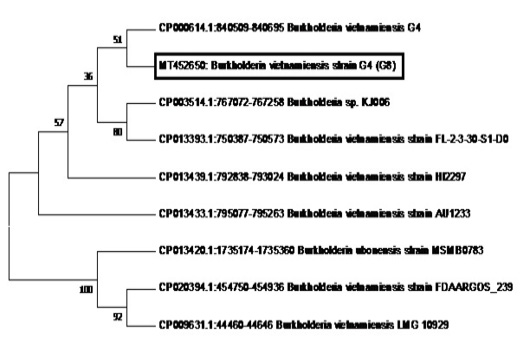
Figure 6
Phylogenetic tree showing the relationship of sample G8 (in the box with Accession Number MT452650) to B. vietnamiensis sequences registered in GenBank.


