Advances in Animal and Veterinary Sciences
Research Article

Multivariate Analysis of Morphometric Differentiation in the Red Sokoto and Boer Goats
H.A. Muhammad1*, Y.Garba2, D.M.Ogah3
1Department of Animal Science, Faculty of Agriculture, Bayero University, Kano, P.M.B 3011 Kano, Nigeria; 2Centre for Dryland Agriculture, Bayero University, Kano, P.M.B 3011 Kano, Nigeria; 3Department of Animal Science, Faculty of Agriculture, Nasarawa State University, Keffi, Shabu-Lafia Campus, P.M.B. 135, Lafia, Nigeria.
Abstract | The study was conducted to evaluate morphological variability of Red Sokoto and exotic Boer goat breeds at the Centre for Dryland Agriculture farm, Bayero University, Kano, Nigeria using multivariate discriminant analysis. Nineteen morphometric traits (wither height, body length, cannon length, lateral length, heart girth, chest depth, hip width, hip length, hip height, neck length, head circumference, face length, face width, shoulder width, right ear length, left ear length, right horn length, left horn length and tail length) and live body weight of each animal were measured. In the prediction of body weight, the multiple regressions found nine parameters to be significant (P<0.05) for Red Sokoto (FL, CL, LL, HW, SW, HC, HH, RHL and HL) and Boer goats (HG, BL, WH, REL, FL, SW, NL, FW and HH) with R2 values of 29 and 80%, respectively. The stepwise discriminant analysis revealed that right ear length followed by left ear length, left horn length, tail length, head circumference, neck circumference, neck length and body weight had significant discriminating power on the two goat breeds studied. The between–breeds Mahalanobis distance matrix was significant (P<0.0001) and this shows the existence of measurable group differences between the two goat breeds studied. The genetic potential due to the larger body weight and morphometric traits of the Boer compared to the Red Sokoto breed gives it an advantage for selection as meat purpose breed. The phenotypic differences obtained in this study could be complemented with further molecular analysis that could assist in the conservation and improvement of the indigenous breeds through appropriate selection and breeding programmes.
Keywords | Red Sokoto goat, Boer, Discriminant, Morphometric, Multivariate.
Received | January 21, 2021; Accepted | January 26, 2021; Published | February 20, 2021
*Correspondence | H.A. Muhammad, Department of Animal Science, Faculty of Agriculture, Bayero University, Kano, P.M.B 3011 Kano, Nigeria; Email: hamuhammad.asc@buk.edu.ng
Citation | Muhammad HA, Garba Y, Ogah DM (2021). Multivariate analysis of morphometric differentiation in the red sokoto and boer goats. Adv. Anim. Vet. Sci. 9(4): 595-603.
DOI | http://dx.doi.org/10.17582/journal.aavs/2021/9.4.595.603
ISSN (Online) | 2307-8316; ISSN (Print) | 2309-3331
Copyright © 2021 Muhammad et al. This is an open access article distributed under the Creative Commons Attribution License, which permits unrestricted use, distribution, and reproduction in any medium, provided the original work is properly cited.
INTRODUCTION
Genetic programmes and better management can contribute immensely to genetic improvement of goat productivity in Nigeria (Abd-Allah et al., 2015). The authors further stated that genetic parameters and attributes of the animals for economic traits should be appraised regularly to enable breeders determine the breeding tools of their choice and also to optimize gains from environmental influences.
The goat (Capra hircus, L.) represents one of the most important livestock species found in many parts of the world. Goats were the first animals to be domesticated by humans about 10,000 years ago and developed around the world into hundreds of different breeds (Hatziminaoglou & Boyazoglu, 2004; Park & Haenlein, 2006). The number of goats has increased globally to an estimated population of about 900 million, out of which 78.0 million are reared in Nigeria (FAOSTAT, 2017). The largest numbers of goats are found in Asia, followed by Africa, representing about 59.7 and 33.8 %, adding up to 93.5 % of the total world population. The lowest population of goats is found in Oceania, which accounts for 0.1 % of the world global population (FAOSTAT, 2008). China, India, Pakistan and Bangladesh have the highest populations of about 60% of the world’s goat population.
The Red Sokoto (Maradi) is the most important breed that is widely distributed in Northern Nigeria and is estimated to represent half of the total goat population in the country (Makun et al., 2005). The Red Sokoto goat is usually deep red and occasionally lighter in colour with both sexes horned. The ears are short with medium width and usually carried horizontally. Beards are present in males and absent in females. Its withers are not prominent and it possesses droopy long ears and well developed udder (Otoikhian and Orheruata, 2010).
The South African Mutton and Goat Performance and Progeny Testing Scheme developed the improved Boer breed in 1970 after selection for enhanced weight gain (Casey & Van Niekerk, 1988; Campbell, 2003). The meat quality, adaptability of the breed and its ability to perform well under extensive semi-arid climatic conditions, ranging from hot dry seasons to the extremely low temperatures of some mountainous regions, are among their comparative advantages (Casey & Van Niekerk, 1988; Barry & Godke, 1997). Boer goat (Capra aegagrus hircus) is considered to be one of the most desirable goat breeds for meat production. It has gained worldwide recognition for excellent body conformation and good carcass quality. It was demonstrated that Boer goats can improve the productive performance of many breeds through cross breeding having significant impact on the meat goat industry globally (Lu, 2001). They are usually white colored with brown or red heads.
Genetic improvement of goat breeds in growth, linear and other traits is advantageous and depends on certain important genetic morphometry which leads to the adaptation and fitness in their production environment. The value of livestock increases in relation to its adaptation and capacity to contribute to the socio-economy and fulfill market opportunities for enhanced productivity (Mamabolo and Webb, 2005).
A concept that refers to the quantitative analysis of form, size and shape is known as morphometrics. It is commonly used to analyse the phenotypic characteristics of farm animals (Elewa, 2004) and the traits can be grouped into three categories as those associated with length, height and girth (Yakubu, 2010).
The phenotypic characterization of breeds of livestock have been previously restricted to the use of analysis of variance, whereas the current trend involves the use of multivariate statistical tools in livestock classification (Traore et al., 2008; Yakubu & Akinyemi 2010; Peter et al., 2012; Aziz & Al-Hur, 2013).
Morphological measurements are very important in assessing the characteristics of various breeds of animal as they can help in providing basic information on the suitability of animals for selection (Nesamvuni et al., 2000; Mwacharo et al., 2006; Martins et al., 2009; Yakubu, 2010). Dossa et al. (2007) reported that morphological measurements such as heart girth, height at withers and body length can be used for rapid selection of large size individuals in the field to enable the establishment of elite flocks. They enable the breeder to recognize early maturing and late maturing animals of different sizes (Nesamvuni et al., 2000).
In view of the importance of these morphometrics, therefore this study aimed to evaluate the morphometric differentiation of pure-bred Red Sokoto and Boer goats in semi-arid Nigeria.
MATERIALS AND METHODS
Description of the study location
The study was conducted in the pure breed herd of Red Sokoto and Boer goats of the Centre for Dryland Agriculture training and research farm, Bayero University, Kano, Nigeria. The GPS coordinates of the Research Farm lies within longitude 11058.771´ East and latitude 8025.851´ North at an altitude of 472 m above sea level. The average monthly minimum and maximum temperature of the study location were 18.6oC and 34oC respectively. The total annual rainfall and average relative humidity were 1396 mm and 45.4 % respectively (Nigerian Meteorological Agency; NiMet, 2014). The period of the study covered August, 2017 to March, 2019.
Experimental Animals and their Management
Ten pure South African Boer goats were purchased from Majestic Dairy Farm Birnin Kudu, Jigawa State, Nigeria, comprising of eight does and two bucks. The twenty pure Red Maradi goats comprising of seventeen does and three bucks were purchased from the Secondary Center of Caprine Breeding, Maradi, Republic of Niger and used for the study.
Animals used were in the age range of 9 to 12 months old. Ages were determined through records and dentition. Pregnancy diagnoses as well as inspection of the general health of the animals were carried out before purchase. Animals were quarantined for two weeks before commencement of the study and another two weeks for adaptation. Animals were kept in pens with half wall for adequate ventilation
Table 1: Description of Morphometric Measurements
| Variables | Description |
| Heart girth (HG) | The circumference of the body, slightly behind the shoulders and perpendicular to the body axis. |
| Body length (BL) | The distance from the shoulder point to the point of the pin bone of the tail region. |
| Wither height (WH) | The vertical distance from the floor to the top of the shoulder. |
| Hip height (HH) | The vertical distance from the floor to the highest point in the region of the hooks or pelvic girdle. |
| Hip width (HW) | The horizontal distance across the widest point of the hips. |
| Shoulder width (SW) | The horizontal distance across the widest point of the shoulders. |
|
Neck length (NL) |
Measured as the region of the cervical vertebrae. |
| Ear length (EL; Right and Left) | Measured from the point where the ear is attached, to its tip. |
| Horn length (HL; Right and Left) | Measured from the point of its attachment of the horns to the head up to its tip. |
| Tail length(TL) | From caudal vertebrae/tail base to tip. |
| Cannon Length (CL) | Length of the cannon. |
|
Chest Depth (CD) Head Circumference (HC), Lateral Length (LL), Face Length (FL), Face Width (FW) |
Distance from the lowest point of the wither region to the sternum.
|
The experimental pens were thoroughly cleaned and disinfected before the transfer of the animals and sanitation was carried out on regular basis throughout the study period. The animals were offered feed and clean drinking water ad libitum.
The animals were treated against endoparasites with Albendazole suspension at 7.5 mg per kg body weight and Oxytetracycline (a long acting formulation) at 10 mg per kg body weight. External parasites were also controlled using Pour-on® containing Cypermetrine. Sick animals were isolated and treated as appropriate. The goats were raised in a semi-intensive system with concentrates and roughages offered twice a day (5% of body weight). The concentrate mixtures contained 19.14% crude protein which was fed to the animals in the morning and evening. Feed ingredients used in formulating the diets include cottonseed cake, wheat offal, rice mill waste, poultry litter, cowpea husk, “Kalgo pods” (Piliostigma reticulatum), groundnut hay and salt. The mixture of concentrate and roughage provided was in the ratio of 60:40, respectively. Roughage in the form of groundnut hay was provided to the animals ad libitum.
Data Collection
Data on relevant parameters were collected at the different phases of the study:
Growth Traits: Live body weights (kg) of Red Sokoto and Boer were measured after every four weeks up to a period of one year. A sensitive weighing scale was used to measure the live body weight of the animals. It was obtained by taking the weight of the animal and the researcher and later the researcher’s weight subtracted from the total to get the actual body weight of the animal (Rotimi et al., 2015).
Measurement of Morphometric Characteristics: The goats were properly restrained while taking the measurements to ensure accuracy. Measurements were done in the morning before feeding the animals using flexible measuring tape graduated in centimetres (cm).The morphometric traits were measured once in a month (four weeks) for a period of one year. Sets of morphometric measurements were taken from nineteen traits as described by Brown et al. (1983), Hagan et al. (2012) and (Akpa et al., 2014). The table below shows the reference points used:
Statistical analysis
Data collected were screened for missing values and outliers prior to analysis. All data analyses were executed using Excel, XLSTAT and JMP pro 14.0 Statistical Analysis System (SAS, 2018).
Multivariate Analysis
Multiple linear regression models were used for estimation of body weight using the important morphometric variables. The multiple linear regression model used is as follow:
Yj = β0 + β1X1 + β2X2 + β3X3 + β4X4 + β5X5 + β6X6 + β7X7 + β8X8 + β9X9 + β10X10 + β11X11 + β12X12 + β13X13 + β14X14 + β15X15 + β16X16 + β17X17 + β18X18 + β19X19 + ej
Where;
Yj = the dependent variable body weight;
β0 = the intercept;
The independent variables as X1= wither height, X2=body length, X3=cannon length, X4=lateral length, X5=heart girth, X6=chest depth, X7=hip width, X8=hip length, X9=hip height, X10=neck length, X11=head circumference, X12=face length, X13=face width, X14=shoulder width, X15=right ear length, X16=left ear length, X17=right horn length, X18=left horn length andX19= tail length.
β1, β2, β3, β4, β5, β6, β7, β8, β9, β10, β11, β12, β13, β14, β15, β16, β17, β18 and β19 are the regression coefficient of the variables X1, X2, X3, X4, X5, X6, X7, X8, X9, X10, X11, X12, X13, X14, X15, X16 X17, X18, and X19 respectively; ej= residual error.
Canonical discriminant analysis; a multivariate technique was used to identify the combination of variables that clearly separate the two genetic groups. This analysis is a multivariate technique that describes the relationship between two variable sets by calculating the linear combinations that are maximally correlated (Tabachnick & Fidel, 2001). Discriminant analysis was used to classify the sampled populations into homogenous groups on the basis of the measured variables. Stepwise discriminant analysis procedure (PROC STEPDISC) was employed to identify the relative importance of variables in discriminating identified goat breeds. The CANDISC procedure was used to generate the univariate test of the selected traits, canonical functions and the plots of breed membership. The PROC DISCRIM was employed to obtain the Mahalanobis distances and linear discriminant functions. The stepwise REG procedure of SAS (2005) was used to determine the relative importance of live-animal body measurements in a model designed to predict body weight. Variables that best fitted the model were selected using C(p) statistic, Alkaike’s Information Criteria (AIC), Bayesian Information Criteria (BIC), R2 (R-square) and MSE (Mean square of error).
RESULTS
Multiple Regression Analysis of Live Body Weight on Different Body Measurements of Red Sokoto and Boer Goats
The results of the multiple regression analysis indicated that nine parameters were significantly (P<0.05) different for Red Sokoto (face length, cannon length, lateral length, hip width, shoulder width, head circumference, hip height, right horn length and hip length) and Boer goats (heart girth, body length, wither height, right ear length, face length, shoulder width, neck length, face width and hip height) with R2 values of 29 and 80%, respectively (Table 2). Results revealed that HG alone accounted for 74 % of the variation in BW of Boer goat. The best prediction equation for BW with R2 = 0.80 was obtained when HG, BL, WH, REL, FL, SW, NL and FW were included in the model for Boer goat. The R2 in RS was low in the BW predicting model.
Significant Traits that Discriminated the Goat Breeds
Discriminant analysis was carried out using twenty quantitative variables (body weight, wither height, body length, cannon length, lateral length, heart girth, chest depth, hip width, hip length, hip height, neck length, head circumference, face length, face width, shoulder width, right ear length, left ear length, right horn length, left horn length and tail length to identify as best discriminating variables on stepwise selection summary as shown in Table 3. Based on the significant (P<0.01; P<0.0001) differences observed only seven variables (right ear length, left ear length, left horn length, tail length, head circumference, neck circumference, neck length and body weight) had significant discriminating powers on the two goat breeds studied while the remaining variables that showed non significance (P>0.03 or P>0.05) were dropped.
Mahalanobis Distance between the Boer and Red Sokoto Goats
The Mahalanobis distance between the Boer and Red Sokoto goats is presented in Table 4. All pair wise distances were highly significant (P<0.0001). This shows the existence of measurable group differences between the two goat breeds studied.
Multivariate Statistics
The multivariate statistics is presented in Table 5. The multivariate statistics for the differences between the breeds were significantly (P<0.0001) different in the four multivariate tests (Wilk’s Lambda, Pillai’s Trace, Hotelling-Lawley trace and Roy’s greatest root).
Standardized Canonical Discriminant Function Coefficients
Standardized canonical discriminant function coefficients are presented in Table 6. The standardized canonical coefficients indicate the partial contribution of each variable to the discriminant function, controlling for other attributes listed in the equation. Thus, the explanatory variables, right ear length, left ear length, body weight, tail length and head circumference contributed to the first canonical variable (CAN1). The correlation between CAN and the goat populations/breeds sampled was high (0.80).
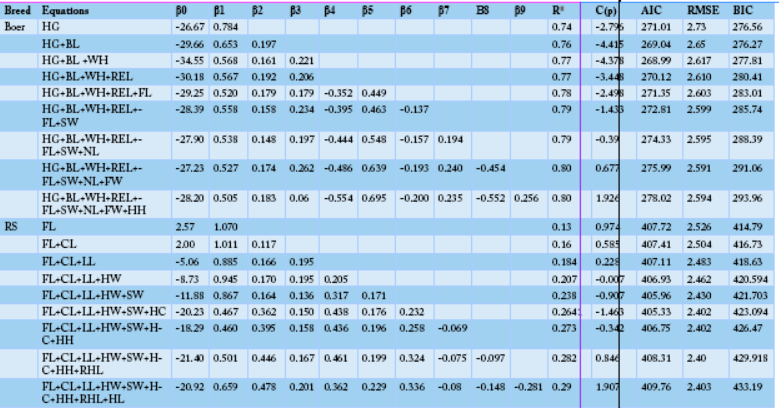
Table 2: Multiple Regression Analysis of Live Body Weight on Different Body Measurements of Red Sokoto and Boer Goats
HG=Heart; Girth BL=Body Length; WH=Wither Height; REL=Right Ear Length; FL=Face Length; SW=Shoulder Width; NL=Neck Length; FW=Face Width; HH= Hip Height; CL= Cannon Length; LL= Lateral Length; HW=Hip Width; HC= Head Circumference; RHL= Right Horn Length; HL= Hip Length and RS=Red Sokoto
Table 3: Significant Traits that Discriminated the Goat Breeds
| Step | Variables | Partial R² | F | Pr> F | Wilks' Lambda | Pr< Lambda |
| 1 | Right Ear Length | 0.863 | 872.817 | < 0.0001 | 0.137 | < 0.0001 |
| 2 | Left Ear Length | 0.074 | 10.959 | 0.001 | 0.126 | < 0.0001 |
| 3 | Left Horn Length | 0.074 | 10.940 | 0.001 | 0.117 | < 0.0001 |
| 4 | Tail Length | 0.070 | 10.213 | 0.002 | 0.109 | < 0.0001 |
| 5 | Head Circumference | 0.066 | 9.490 | 0.003 | 0.102 | < 0.0001 |
| 6 | Neck Length | 0.037 | 5.111 | 0.025 | 0.098 | < 0.0001 |
| 7 | Body Weight | 0.062 | 8.692 | 0.004 | 0.092 |
< 0.0001 |
The p-values for both Wilks’ Lambda were highly significant (P< 0.0001)
Table 4: Mahalanobis Distance between the Boer and Red Sokoto Goats
| Boer | Red Sokoto | |
| Boer | 0 | 39.019 |
| Red Sokoto | 39.019(***) |
0 |
***P<0.0001
Table 5: Multivariate Statistics
| Statistics | Value | F-value | Num Df | Den Df | Pr>F or P-value |
| Wilk’s Lambda | 0.092 | 186.614 | 7 | 132 | <0.0001 |
| Pillai’s Trace | 0.908 | 186.614 | 7 | 132 | <0.0001 |
| Hotelling-Lawley trace | 9.896 | 186.614 | 7 | 132 | <0.0001 |
| Roys greatest root | 9.896 | 186.617 | 7 | 132 |
<0.0001 |
Table 6: Standardized Canonical Discriminant Function Coefficients
| Variable | F1 (CAN1) |
| Body weight (kg) | 0.322 |
| Neck length (cm) | -0.292 |
| Right ear length (cm) | 0.663 |
| Left ear length (cm) | 0.455 |
| Head circumference (cm) | 0.258 |
| Left horn length (cm) | -0.581 |
| Tail length (cm) | 0.312 |
DISCUSSION
Genetic variation is vital for the populations to adapt to varying environments and to respond to artificial selection; therefore, any conservation and development scheme should start from assessing the state of variation in the population (Toro et al., 2011). Discriminant analysis is used to model the value of a dependent categorical variable based on its relationship to one or more predictors. Discriminant analysis of morphometric traits is widely used in determining the relationships among different breeds of livestock (Carneiro et al., 2010; Ajayi et al., 2012). Thus, in assessing morphological diversity, more than three phenotypic variables should be included in order to minimize ambiguity in classification (Sanni et al., 2018). Some of the discriminating variables in this study are similar to those reported by other researchers for sheep (Yakubu et al., 2011) and goats (Netsanet et al., 2017).
The Wilks’ Lambda result from stepwise discriminant procedure shows the variables that contribute to the model; secondly, they are better at discriminating between groups and thirdly the discriminant model as a whole fit the data (Sanni et al., 2018). This study revealed that there is significant morphological variability between Red Sokoto goats and South African Boer goat breeds. This morphological differentiation may be relative to the inherent genetic potential of each breed, geographical isolation and ecological variation (Gizaw et al., 2007; Agaviezor et al., 2012). Wilks’ Lambda test, which is the ratio of within-group variability to total variability on the discriminating variables, is an inverse measure of the importance of the discriminant functions (Brown and Tinsley, 1983; Betz, 1987; Huberty, 1994). In this case, the value of Wilks’ Lambda was 0.09. This shows that most of the variability in the discriminating variables was because the difference was between the breeds.
Mahalanobis distance was estimated from the mean values of right ear length, left ear length, left horn length, tail length, head circumference, neck circumference, neck length and body weight. The significant pairwise distances shows the existence of measurable group differences between the two goat breeds studied.
The high morphometric variation between Boer and Red Sokoto goat breeds suggests the possibility of obtaining heterotic gains (Zahraddeen et al., 2008). In addition, the South Africa Boer goat is a promising goat breed in terms of its growth performance (Zahraddeen et al., 2008). The pairwise distances of the discriminant function provide helpful information which could aid breeding and conservation strategies of the studied goat species. The comparative assessment of the growth and carcass potentials of crossbreds obtained from crosses between Boer and Red Sokoto goat breeds would further clarify these hypotheses. Adaptive divergence in morphological traits was higher between Red Sokoto and Boer goats. This indicates higher genetic distance between the breeds that could have been facilitated by the nature of the improved exotic pure Boer breed. Gizaw et al. (2007) obtained a strong indication of adaptive divergence in morphological characters during the morphometric differentiation of Ethiopian sheep into nine breeds. Discriminant analysis however, has been used to separate West African Dwarf and Red Sokoto goats into distinct genetic groups with a long Mahalanobis distance of 72.3 (Yakubu et al., 2010a)
Conclusion
It can be concluded from the study that in the prediction of body weight, the multiple regressions found nine parameters to be significant for Red Sokoto (FL, CL, LL, HW, SW, HC, HH, RHL and HL) and Boer goats (HG, BL, WH, REL, FL, SW, NL, FW and HH). Right ear length, left ear length, left horn length, tail length, head circumference, neck circumference, neck length and body weight were the most discriminating variables that separates the two goat breeds. Thus, selection could focus on these traits for genetic improvement programmes. The genetic potential due to the larger body weight and morphometric traits of the Boer compared to the Red Sokoto breed gives it an advantage for selection as meat purpose breed. The phenotypic differences obtained in this study could be complemented with further molecular analysis that could assist in the improvement of the Red Sokoto goat.
Acknowledgements
The authors wish to thank the Centre for Dryland Agriculture (CDA); a world bank Africa Centre of Excellence, for allowing the use of their animals and facilities at Bayero University, Kano and for the financial support in publishing the paper.
Conflict of Interests
The authors declared no conflict of interest.
authors contribution
H. A. Muhammad: developed idea / concept of the research, conduct of study, data collection, data entry, data analysis, results interpretation and discussion and preparation of draft manuscript.
Y. Garba: Involved in developing and design of the study, data cleaning, editing of discussion component, final proof reading of manuscript.
D.M. Ogah: developed and designed the concept of the work, Outline of methodology, editing and proof reading of manuscript.
References


