Advances in Animal and Veterinary Sciences
Research Article

Morphological Structure of South African Non-Descript Does Raised in Syferkuil Farm, Capricorn District of Limpopo Province Using Factor Analysis
Thobela Louis Tyasi1*, Widya Pintaka Bayu Putra2
1Department of Agricultural Economics and Animal Production, University of Limpopo, Polokwane, South Africa 0727; 2Research Center for Biotechnology, Indonesian Institute of Science, Cibinong, Indonesia 16911.
Abstract | Goat is one of important livestock in Africa for meat and milk productions. This research was aimed to characterize the morphological structure in South African non-descript does (1-2 years of age). Two body parameters including body measurements (14 variables) and body indices (11 variables) were used in this study and taken from fifty (n = 50) does. The data of two body parameters were used to characterize the animal’s morphological structure. Factor analysis including Pearson’s correlations, Principal Component Analysis (PCA) and multiple regression analysis were used for evaluations. Results of Pearson’s correlation analysis of body measurements indicated that body weight had a positive and highly statistical association with body length (r = 0.84, P<0.01). While in body indices the body weight had a positive and highly statistical correlation with area index (r = 0.83, P<0.01). PCA results showed that two body parameters in this study were explained about 80% of total variance in animal’s morphological structure. Despite, three PC’s of body indices in does have very high correlation with body weight (R2 = 0.82). Meanwhile, four PC’s of body measurements in does have moderate correlation with body weight (R2 = 0.59). It can be concluded that six body measurements (bicostal diameter, ear length, head width, head length, heart girth, cannon circumference) and six body indices (length index, depth index, conformation index, proportionality, thoracic development, cannon thickness index) were classified into first component that explain about 30.06% in body measurements and 48.88% in body indices. The results revealed that the first component in the body indices can be used as the criteria for South African non-descript goat because it represents the animal’s morphological structure and body weight.
Keywords | Body weight, Body measurements, Body indices, Pearson correlation, Multiple regression analysis
Received | December 08, 2020; Accepted | December 19, 2020; Published | February 20, 2021
*Correspondence | Thobela Louis Tyasi, Department of Agricultural Economics and Animal Production, University of Limpopo, Polokwane, South Africa 0727; Email: louis.tyasi@ul.ac.za
Citation | Tyasi TL, Putra WPB (2021). Morphological structure of south african non-descript does raised in syferkuil farm, capricorn district of limpopo province using factor analysis. Adv. Anim. Vet. Sci. 9(4): 555-562.
DOI | http://dx.doi.org/10.17582/journal.aavs/2021/9.4.555.562
ISSN (Online) | 2307-8316; ISSN (Print) | 2309-3331
Copyright © 2021 Tyasi and Putra. This is an open access article distributed under the Creative Commons Attribution License, which permits unrestricted use, distribution, and reproduction in any medium, provided the original work is properly cited.
Introduction
Goat farming plays a very crucial role in the economy through job creation and is of cultural significance in many rural set up (Webb et al., 2003). South African non-descript goat is indigenous goat breed which is usually found in communal areas of South Africa (Webb et al., 2003; Tyasi et al., 2020). This goat breed is resistance to parasites and some diseases (Ramukhithi et al., 2019). According to Mahieu et al. (2011) prediction of body weight in small ruminant such as goats is a useful tool for farmers to understand medication doses, adjusting feed supply, observing growth and choosing which male and female to use during breeding. However communal farmers find it difficult to get an access to weighing scale as it is very much expensive (Nsoso et al., 2003). Khan et al. (2006) indicated that the relationship between morphological traits and body weight is positive in goats and could be used as selection criteria for the body weight. Tyasi et al. (2020) assessed the relationship between body weight and morphological traits of South African non-descript indigenous goats using Pearson correlation and simple regression analyses. However, based to the level of our knowledge there are no literature on the use factor analysis to assess morphostructure of South African non-descript goats and their relationships with body weight. Hence, the objective of the study was to characterize the morphological structure of South African non-descript does using body measurements and body indices. This study will help indigenous goat farmers to select the best morphological traits that might be used for improving body weight during breeding season.
MATERIALS AND METHODS
Research Site And Animals
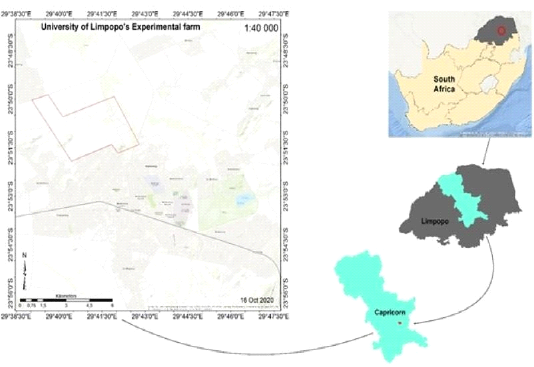
The study was conducted at the University of Limpopo experimental farm (Syferkuil) Limpopo province, South Africa as presented in Figure 1. The farm is located 10 km in the north-west of university of Limpopo. The university lies upon the latitude of 27.55 ºS and longitude 24.77 ºE. Temperature around the area is above 32 °C during summer and between 5 and 25 °C during winter seasons.
Body Parameters
Live weight of each doe was measured using weighing scale in kilograms (kg) (Model QAL-SGP Live weight scale, SCALE TRONIC SERVICES (PTY) LTD, Johannesburg, South Africa) with the internal dimension of 136cm (length) x 57cm (Width) x 78cm (Height) with the capacity of 600kg x 200g and 2 x slide gates. Total of fourteen (14) body measurements viz: withers height (WH), rump height (RH), body length (BL), sternum height (SH), body depth (BoD), bicostal diameter (BiD), ear length (EL), rump width (RW), head width (HW), rump length (RL), head length (HL), heart girth (HG), cannon circumference (CC) and muzzle diameter (MD) were measured referring to Figure 2 and a total of eleven (11) body indices were calculated using the equations described by Salako (2006), Chacon et al. (2011) and Khargharia et al. (2015) as follows:
Cephalic index (CpI) = (HW/HL) ×100 Length index (LI) = (BL/WH) ×100 Height index (HI) = (WH/RH) ×100 Depth index (DI) = (BD/WH) ×100 Body index (BI) = (BL/HG) ×100 Conformation index (CI) = HG2/WH Proportionality (Pr) = (WH/BL) ×100
Dactyl thorax index (DTI) = (CC/HG) ×100 Thoracic development (TD) = (HG/WH) ×100 Cannon thickness index (CTI) = (CC/WH) ×100 Area index (AI) = WH × BL
According to BI value, the goat can be described as three categories of brevigline (BI<85.0), medigline (85.0<BI<88.0) and longiland (BI>88.0). According to DTI value, the goat can be described as four categories of light animal (DTI<10.5), intermediary animal (10.6<DTI<10.8), light meat animal (10.9<DTI<11.0) and heavy meat animal (DTI>11.0). Moreover, goat with TD value more than 120 was included of good performance (Chacon et al., 2011; Khargharia et al., 2015; Chiemela et al., 2016).
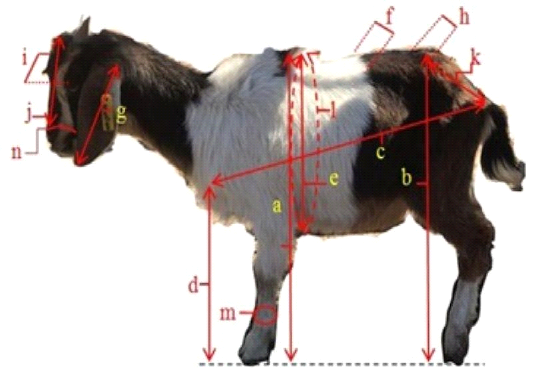
Figure 2: The scheme of body measurements in a South African non-descript doe consisted of withers height (a), rump height (b), body length (c), sternum height (d), body depth (e), bicostal diameter (f), ear length (g), rump width (h), head width (i), head length (j), rump length (k), heart girth (l), cannon circumference (m) and muzzle diameter (n).
Statistical Analysis
Data was analyzed using Statistical Packages for Social Sciences version 26 (IBM SPSS, 2019). Descriptive statistics such as mean, standard deviation (SD), coefficient of variation (CV), minimum and maximum values were computed. Pearson’s coefficient of correlation (r) and Principal Component Analysis (PCA) were computed as described by Yakubu, (2011). The following PCA equation was used:
PCp = a1p x1 + a2p x2 + + anp xn
where, PCp is the pth principal component; anp is the nth vector Eigen of the pth principal component and xn is
Table 1: Descriptive statistics of body weight and body measurements in South African non- descript does
| Parameter | Mean | SD | CV (%) | Min. | Max. |
| Body weight (kg) | 32.92 | 7.22 | 21.93 | 20.00 | 46.00 |
| Withers height (cm) | 61.52 | 9.18 | 14.92 | 49.00 | 79.00 |
| Rump height (cm) | 55.40 | 8.01 | 14.46 | 39.00 | 68.00 |
| Body length (cm) | 68.35 | 6.34 | 9.28 | 56.00 | 80.20 |
| Sternum height (cm) | 37.72 | 6.34 | 16.81 | 29.00 | 68.00 |
| Body depth (cm) | 70.31 | 7.38 | 10.50 | 36.00 | 90.00 |
| Bicostal diameter (cm) | 27.93 | 4.62 | 16.54 | 21.00 | 36.00 |
| Ear length (cm) | 17.33 | 1.20 | 6.92 | 15.50 | 20.30 |
| Rump width (cm) | 15.94 | 1.09 | 6.84 | 13.00 | 19.30 |
| Head width (cm) | 15.72 | 1.10 | 7.00 | 14.40 | 19.00 |
| Rump length (cm) | 17.62 | 1.15 | 6.53 | 15.80 | 19.80 |
| Head length (cm) | 21.77 | 1.20 | 5.51 | 20.00 | 23.80 |
| Heart girth (cm) | 78.39 | 6.65 | 8.48 | 64.80 | 103.00 |
|
Cannon circumference (cm) |
11.31 | 0.75 | 6.63 | 10.00 | 12.60 |
| Muzzle diameter (cm) | 21.49 | 1.88 | 8.75 | 18.90 |
26.00 |
SD: standard deviation; CV: coefficient of variation; Min.: minimum value; Max.: maximum value
Table 2: Descriptive statistics of body indices in South African non-descript does
| Body indices | Mean | SD | CV (%) | Min. | Max. |
| Cephalic index (%) | 72.22 | 2.81 | 3.89 | 68.00 | 79.83 |
| Length index (%) | 112.90 | 15.59 | 13.81 | 84.81 | 152.80 |
| Height index (%) | 111.59 | 11.21 | 10.05 | 84.75 | 154.90 |
| Depth index (%) | 116.65 | 19.10 | 16.37 | 45.57 | 145.00 |
| Body index (%) | 87.43 | 7.49 | 8.57 | 71.79 | 106.93 |
| Conformation index (cm) | 102.29 | 20.36 | 19.90 | 63.62 | 143.36 |
| Proportionality (%) | 90.22 | 12.28 | 13.61 | 65.45 | 117.91 |
| Dactyl thorax index (%) | 14.48 | 1.04 | 7.18 | 12.23 | 16.67 |
| Thoracic development (%) | 129.97 | 20.54 | 15.80 | 98.18 | 165.20 |
| Cannon thickness index | 18.73 | 2.74 | 14.63 | 14.59 | 24.08 |
|
Area index (cm2) |
4231.30 | 886.31 | 20.95 | 3100.00 |
5934.80 |
SD: standard deviation; CV: coefficient of variation; Min.: minimum value; Max.: maximum value
the nth observed variables. Kaiser-Meyer-Olkin (KMO) measures of sampling adequacy, Bartlett’s test of sphericity and communality were computed as the test validity. The KMO statistics ranges between 0 and 1. The value close to 0 indicates that there are large partial correlations compared to the total of correlations. A value close to 1 indicates that the sampling is appropriate. It was possible to accept a measure of sampling adequacy greater than 0.50. The varimax criterion of the orthogonal rotation method was employed in the rotation of the factor matrix to enhance the interpretability of the factor analysis. In addition, multiple linear regression was performed to identify the accuracy level in all principal components (PC’s) when used as BW predictors. Hence, the best multiple linear regression was based on the coefficient of determination (R2) value. Thus, the R2 value has three categories of very low (R2<0.20), low (0.20<R2<0.40), moderate (040<R2<0.60), high (0.60<R2<0.80) and very high (0.80<R2<1.00).
RESULTS AND DISCUSSION
Body Weight
The average of body weight and morphological traits of South African non-descript does are presented in Table 1. The average of BW in south African non-descript does was 32.92 kg and higher than Malaysian Katjang (23.65 kg); Indonesian Katjang (27.11 kg); Assam Hill (24.86 kg) and Black Bengal (12.4 kg) does. (Khandoker et al., 2016; Putra and Ilham, 2020; Khargharia et al., 2015; Paul et al., 2011). Therefore, the average of BW in South-African non-descript does was closed to Zulu (33.39 kg); Barcha (36.9 kg) and Atlas (38.3 kg) does (Mavule et al., 2013;
Table 3: Pearson’s coefficient correlation between body weight and body measurements in South African non-descript does
| Variable | BW | WH | RH | BL | SH | BoD | BiD | EL | RW | HW | RL | HL | HG | CC |
| Body weight (BW) | - | - | - | - | - | - | - | - | - | - | - | - | - | - |
| Withers height (WH) | 0.63** | - | - | - | - | - | - | - | - | - | - | - | - | - |
| Rump height (RH) | 0.35* | 0.77** | - | - | - | - | - | - | - | - | - | - | - | - |
| Body length (BL) | 0.84** | 0.46** | 0.32* | - | - | - | - | - | - | - | - | - | - | - |
| Sternum height (SH) | 0.40** | 0.78** | 0.54** | 0.31* | - | - | - | - | - | - | - | - | - | - |
| Body depth (BoD) | 0.39** | 0.10 | 0.24 | 0.52** | -0.31* | - | - | - | - | - | - | - | - | - |
| Bicostal diameter (BiD) | 0.49** | 0.41** | 0.37** | 0.57** | 0.46** | 0.11 | - | - | - | - | - | - | - | - |
| Ear length (EL) | 0.34* | 0.25 | 0.25 | 0.45** | 0.35* | 0.01 | 0.88 ** |
- | - | - | - | - | - | - |
| Rump width (RW) | 0.47** | 0.25 | 0.15 | 0.37** | 0.26 | 0.33 * |
0.49 ** |
0.46** | - | - | - | - | - | - |
| Head width (HW) | 0.43** | 0.36* | 0.22 | 0.40** | 0.37** | 0.27 | 0.71 ** |
0.48** | 0.66** | - | - | - | - | - |
| Rump length (RL) | 0.30* | 0.07 | 0.03 | 0.24 | 0.21 | 0.15 | 0.40 ** |
0.50** | 0.76** | 0.46** | - | - | - | - |
| Head length (HL) | 0.39** | 0.29* | 0.20 | 0.39** | 0.27 | 0.17 | 0.78 ** |
0.61** | 0.58** | 0.82** | 0.31 * |
- | - | - |
| Heart girth (HG) | 0.48** | 0.23 | 0.08 | 0.53** | 0.10 | 0.50 ** |
0.54 ** |
0.43** | 0.73** | 0.73** | 0.47 ** |
0.65 ** |
- | - |
| Cannon circumference (CC) | 0.34* | 0.35* | 0.24 | 0.36* | 0.36* | 0.19 | 0.70 ** |
0.50** | 0.46** | 0.85** | 0.36 * |
0.81 ** |
0.55 ** |
- |
| Muzzle diameter (MD) | 0.32* | 0.15 | -0.01 | 0.31* | 0.09 | 0.32 * |
0.40 ** |
0.22 | 0.70** | 0.70** | 0.45 ** |
0.65 ** |
0.71 ** |
0.50 ** |
*(P<0.05); **(P<0.01)
Table 4: Pearson’s coefficient correlation between body weight and body indices in South African non-descript does
| Variable | BW | CpI | LI | HI | DI | BI | CI | Pr | DTI | TD | CTI |
| Body weight (BW) | - | - | - | - | - | - | - | - | - | - | - |
| Cephalic index (CpI) | 0.20 | - | - | - | - | - | - | - | - | - | - |
|
Length index (LI) |
-0.11 | -0.15 | - | - | - | - | - | - | - | - | - |
| Height index (HI) | 0.41** | 0.16 | -0.16 | - | - | - | - | - | - | - | - |
| Depth index (DI) | -0.33* | -0.07 | 0.84** | -0.36** | - | - | - | - | - | - | - |
| Body index (BI) | 0.47** | -0.15 | 0.06 | 0.04 | -0.24 | - | - | - | - | - | - |
| Conformation index (CI) | -0.07 | 0.12 | 0.71** | -0.05 | 0.75** | -0.54** | - | - | - | - | - |
| Proportionality (Pr) | 0.08 | 0.15 | -0.99** | 0.20 | -0.86** | -0.07 | -0.71** | - | - | - | - |
| Dactyl thorax index (DTI) | -0.24 | -0.01 | -0.30 | -0.09 | -0.29* | 0.27 | -0.56** | 0.32* | - | - | - |
| Thoracic development (TD) | -0.34* | -0.05 | 0.84** | -0.17 | 0.88** | -0.49** | 0.92** | -0.83** | -0.40** | - | - |
| Cannon thickness index (CTI) | -0.48** | -0.07 | 0.78** | -0.23 | 0.82** | -0.40** | 0.73** | -0.76** | 0.03 | 0.90** | - |
| Area index (AI) | 0.83** | 0.24 | -0.48** | 0.33* | -0.64** | 0.46** | -0.35* | 0.47** | -0.07 | -0.67** |
-0.76** |
*(P<0.05); **(P<0.01)
Table 5: The results of principal component analysis in the body measurements of South African non-descript does
| Body measurements | PC 1 | PC 2 | PC 3 | PC4 | Communality |
| Withers height | 0.18 | 0.92* | 0.05 | 0.13 | 0.89 |
| Rump height | 0.09 | 0.85* | -0.07 | 0.20 | 0.79 |
| Body length | 0.35 | 0.43 | 0.12 | 0.56* | 0.63 |
| Sternum height | 0.26 | 0.82* | 0.19 | -0.33 | 0.88 |
| Body depth | 0.01 | 0.02 | 0.12 | 0.94* | 0.91 |
| Bicostal diameter | 0.86* | 0.33 | 0.18 | 0.04 | 0.87 |
| Ear length | 0.71* | 0.24 | 0.26 | -0.13 | 0.64 |
| Rump width | 0.35 | 0.13 | 0.84* | 0.23 | 0.90 |
| Head width | 0.77* | 0.15 | 0.40 | 0.23 | 0.83 |
|
Rump length |
0.19 | 0.06 | 0.89* | -0.04 | 0.83 |
| Head length | 0.90* | 0.06 | 0.21 | 0.17 | 0.89 |
| Heart girth | 0.53* | 0.01 | 0.51 | 0.52 | 0.81 |
| Cannon circumference | 0.84* | 0.16 | 0.17 | 0.13 | 0.77 |
| Muzzle diameter | 0.45 | -0.11 | 0.59* | 0.36 | 0.69 |
|
Rotated sums squared loadings Total |
4.21 | 2.66 | 2.51 | 1.94 | - |
| Variance (%) | 30.06 | 19.00 | 17.93 | 13.88 | - |
| Cumulative (%) | 30.06 | 49.06 | 66.99 | 80.87 | - |
| KMO | 0.75 | ||||
| Bartlett’s test | 0.00 |
PC: principal component; KMO: Kaiser-Meiyin-Olkin; *main component
Table 6: The results of principal component analysis in the body indices of South African nondescript does
| Body indices | PC 1 | PC 2 | PC 3 | Communality |
| Cephalic index | -0.12 | 0.35 | 0.44 | 0.34 |
|
Length index |
0.97* | -0.17 | -0.10 | 0.97 |
| Height index | -0.16 | -0.03 | 0.61* | 0.40 |
| Depth index | 0.90* | 0.15 | -0.23 | 0.89 |
| Body index | -0.13 | -0.96* | -0.01 | 0.95 |
| Conformation index | 0.84* | 0.42 | 0.24 | 0.94 |
| Proportionality | -0.97* | 0.18 | 0.09 | 0.98 |
| Dactyl thorax index | -0.46 | -0.12 | -0.65* | 0.65 |
| Thoracic development | 0.92* | 0.37 | -0.08 | 0.99 |
| Cannon thickness index | 0.79* | 0.34 | -0.40 | 0.90 |
| Area index | -0.50 | -0.42 | 0.64* | 0.83 |
|
Rotated sums squared loadings Total |
5.38 | 1.77 | 1.70 | - |
| Variance (%) | 48.88 | 16.07 | 15.41 | - |
| Cumulative (%) | 48.88 | 64.95 | 80.35 | - |
| KMO | 0.64 | |||
| Bartlett’s test | 0.00 |
PC: principal component; KMO: Kaiser-Meiyin-Olkin; *main component
Table 7: Multiple linear regression model of body weight on original body measurements of PC1 and their component score in South African non-descript does
| Prediction equation | R2 | SE |
|
Original body measurements of PC1 as predictors BW = 49.42 + 1.50(BiD) - 2.83(EL) - 0.44(HW) - 1.16(HL) +0.43(HG) - 0.97(CC) |
0.36 |
6.17 |
|
Principal component as predictors BW = 0.05(PC1) + 0.13(PC2) + 0.09(PC3) + 0.20(PC4) - 44.74 |
0.59 |
4.83 |
BW: body weight; BiD: bicostal diameter; EL: ear length; RW: rump width; HW: head width; RL: ump length; HG: heart girth; H: head length; MD: muzzle diameter; CC: canon circumference; R2: coefficient of determination; SE: standard error of regression
Table 8: Multiple linear regression model of body weight on original body indices of PC1 and their component score in South African non-descript does
| Prediction equation | R2 | SE |
|
Original body indices of PC1 as predictors BW = 195.51 - 0.18(LI) - 0.13(DI) + 0.57(CI) - 0.84(Pr) - 0.81(TD) - 0.27(CTI) |
0.76 |
3.80 |
|
Principal component as predictors BW = 0.05(PC1) - 0.08(PC2) + 0.05(PC3) - 18.26 |
0.82 |
3.20 |
BW: body weight; LI: length index; HI: height index; DI: depth index; CI: conformation index; Pr: proportionality; TD: thoracic development; CTI: canon thickness index; AI: area index; R2: coefficient of determination; SE: standard error of regression
Boujenane et al., 2016). Despite, the average of BW in South African non-descript does was lower than Turkish Hair (51.2 kg); Honamli (63.5 kg) and Assaf (75.74 kg) does (Elmaz et al., 2016; Legaz et al., 2011). All the variations in the BW among goat breeds might be due to environmental and breed differences.
Body Indices
The average of body indices in South African non-descript does was presented in Table 2. The average of BI, DTI and TD in South African non-descript does were 87.43 (medigline); 14.48 (heavy meat animal) and 129.97 (good performance) respectively. Putra and Ilham (2020) reported that Indonesian Katjang does was categorized into medigline animal (BI=86.95) and have a good performance (TD = 124) and light meat type of animal (DTI = 10.24). Chacon et al. (2011) reported that Cuban Creole does was categorized into medigline animal (BI = 85.29) and light type of animal (DTI = 9.58). Khargharia et al. (2015) reported that Assam Hill does was categorized into medigline animal (BI = 86.87), light type of animal (DTI = 9.82) and have a good performance (TD = 132). Moreover, Hankamo et al. (2020) reported that Ethiopian indigenous does were categorized into light type of animal (BI = 93.37) and have lower performance than South African non-descript does (TD = 109). The body indices of goat can be affected by genetic factor.
Pearson’s Coefficient Of Correlation
Pearson’s coefficient of correlation (r) between BW and BL in South African non- descript does was 0.84 and included of very high category (r>0.80) as presented in Table 1. Meanwhile, the r value between BW and HG in South African non-descript does was 0.48 and included of moderate category (0.40<r<0.60). Previous studies reported that BW and BL had very high category in Malaysian Katjang (0.83) and Afar (0.83) does and similar to the present study (Khandoker et al., 2016; Tekle, 2014). Despite, the r value between BW and AI in South African non-descript does was 0.83 (very high category) as presented in Table 4. Putra and Ilham (2020) reported that BW and AI in Indonesian Katjang does had r value of 0.64 and included of high category (0.60<r<0.80). Our findings suggest that when BL and AI increase the BW might also increase. Therefore, BL and AI might be used as selection criterion to improve BW in South African non-descript goats.
Principal Component Analysis
Total of four principal components (PC’s) of body measurements (Table 5) and three PC’s of body indices were obtained in this study. Hence, four PC’s of body measurements and three PC’s of body indices were explained in total variance about 80% of animal’s morphostructure. Moreover, the KMO value in PCA of both parameters were higher than 0.05 and reveal that the results of PCA in this study is accurate. In addition, the Bartlett’s test of sphericity value in PCA of both parameters were lower than 0.01 and reveal that the results of PCA in this study is accurate. Putra and Ilham (2020) obtained three PC’s of body measurements (11 body measurements) and four PC’s of body indices (11 body indices) in Indonesian Katjang does that explain in total variance about 64.89% (body measurements) and 86.84% (body indices) of animal’s morphostructure. Previous studies have been worked using PCA of body measurements in Pakistan commercial goats (3PC’s; 98.0%; 5 variables), Red Sokoto goats (3PC’s; 88.92%; 14 variables), West African Dwarf goats (4PC’s; 85.87%; 14 variables) and Nigerian indigenous does (3PC’s; 61.13%; 9 variables) (Eyduran et al., 2013; Yakubu et al., 2011; Shoyombo et al., 2015). Six body measurements of BD, EL, HW, HL, HG and CC were identified as the first component (PC1) in body measurements of South African non-descript does that explain about 30% of total variance in animal’s morphostructure. Meanwhile, six body indices of LI, DI, CI, Pr, TD and CTI were identified as the PC1 of body indices in South African non-descript does that explain about 49% of total variance in animal’s morphostructure. All the body measurements and body indices in PC1 are important for selection criteria in the livestock (Putra and Ilham, 2020).
Multiple Linear Regression
The multiple linear regression equations to predict BW in South African non-descript does were presented in Table 5 (body measurements) and Table 6 (body indices). The coefficient of determination (R2) value in the multiple linear regression with PC was higher than original variables. Hence, the BW in South African non-descript does was influenced about 59% by 4PC’s of body measurements and about 82% by 3PC’s of body indices. Putra and Ilham (2020) reported that about 72% of BW in Indonesian Katjang does was influenced by 3PC’s of body measurements and about 72% by 4PC’s of body measurements. Khargharia et al. (2015) reported that about 76% of BW in Assam Hill goats was influenced by 4PC’s of body measurements. The PC1 of body indices in South African non-descript does (LI, DI, CI, Pr, TD, CTI) can be used as selection criteria with highly correlation to BW (R2 = 0.76).
CONCLUSION
The current study was conducted to investigate the characterization of morphological structure of South African non-descript goats using body measurements and indices. Pearson’s correlation was used first to investigate the relationship between measured traits. Relationship findings suggest that BL and AI had a highly statistical significant correlation with BW of South African non-decript goats. Principal component analysis was used to characterize the morphological structure and the results suggest that six body measurements (bicostal diameter, ear length, head width, head length, heart girth, cannon circumference) and six body indices (length index, depth index, conformation index, proportionality, thoracic development, cannon thickness index) were classified into first component that explain about 30.06% in body measurements and 48.88% in body indices. The results revealed that the first component in the body indices can be used as the criteria for South African non-descript goat because it represents the animal’s morphological structure and body weight.
ACKNOWLEDGEMENT
Authors express appreciation to the University of Limpopo Experimental Farmworkers and Department of Agricultural Economics and Animal Production, the University of Limpopo for data collection and financial support (National Research Foundation Thuthuka Grant No: 121987).
AUTHOR CONTRIBUTIONS
TLT and WPBP designed the experiment, analyzed the data and wrote the manuscript.
CONFLICT OF INTEREST
The Authors have declared no conflict of interest.
REFERENCES


