Advances in Animal and Veterinary Sciences
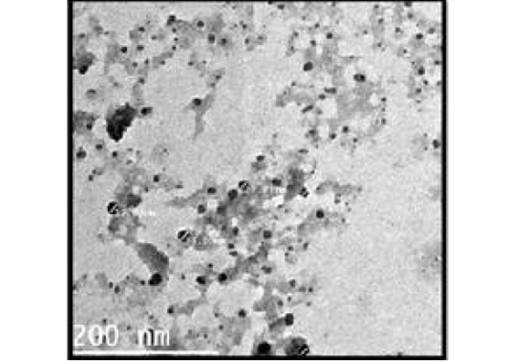
TEM micrograph of ALg-propolis NPs.
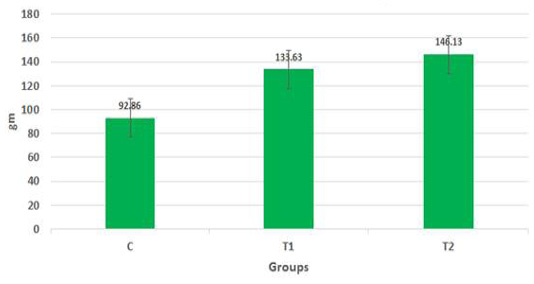
Mean live daily body gain in the different treatments of Egyptian-Nubian goat kids (gm) (x̅ ± Sx̅).
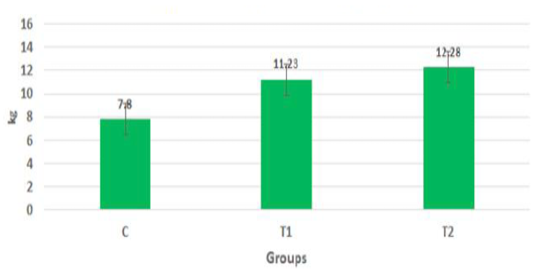
Mean live total body gain in the different treatments of born Egyptian-Nubian goat kids (kg) (x̅ ± Sx̅).
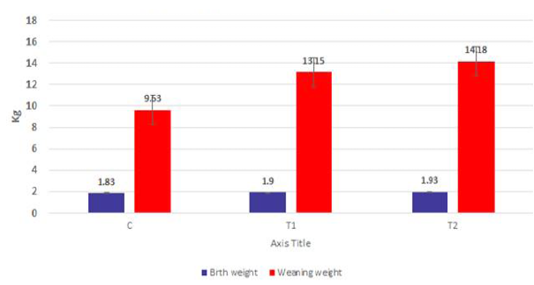
Mean live body weight changes in different treatments of born Egyptian-Nubian goat kids (kg) (x̅ ± Sx̅).
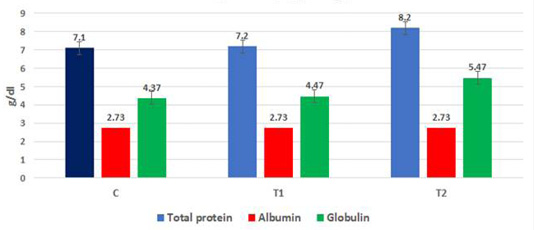
Mean total protein, albumin and globulins in born Egyptian-Nubian goat kids (kg) (x̅ ± Sx̅).
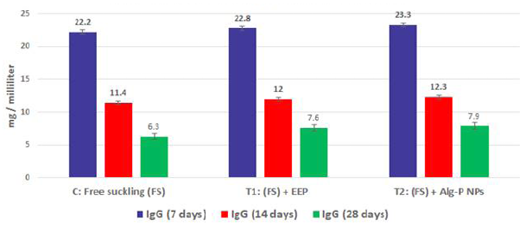
Immunoglobulin G measured from plasma at different ages and feeding systems in Egyptian-Nubian goat kids.

Immunoglobulin A measured from plasma at different ages and feeding systems in Egyptian-Nubian goat kids.

IFN-α measured from plasma at different ages and feeding systems in Egyptian-Nubian goat kids.
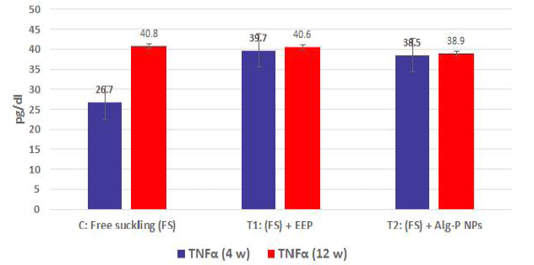
TNFα measured from plasma at different ages and feeding systems in Egyptian-Nubian goat kids.
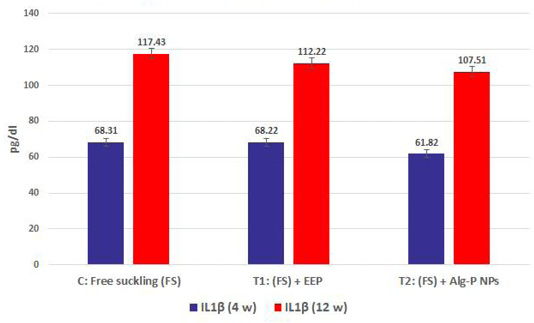
IL1β measured from plasma at different ages and feeding systems in Egyptian-Nubian goat kids.
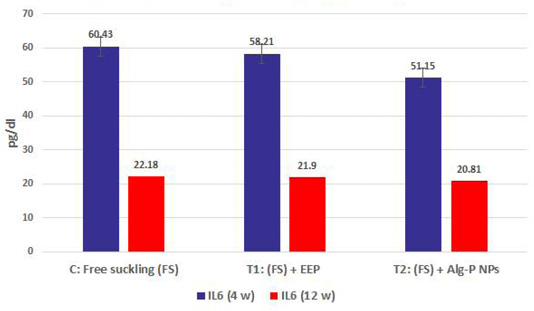
IL6 measured from plasma at different ages and feeding systems in Egyptian-Nubian goat kids.


