Advances in Animal and Veterinary Sciences
Research Article
Adv. Anim. Vet. Sci. 9(2): 265-273
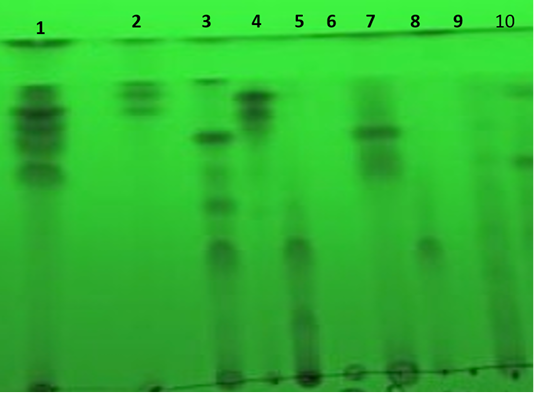
Figure 1
Separation of extracellular secondary metabolites on TLC plate under short wavelength UV light. Where, the numbers from 1 to 10 are the numbers of fungi in the Table 1.
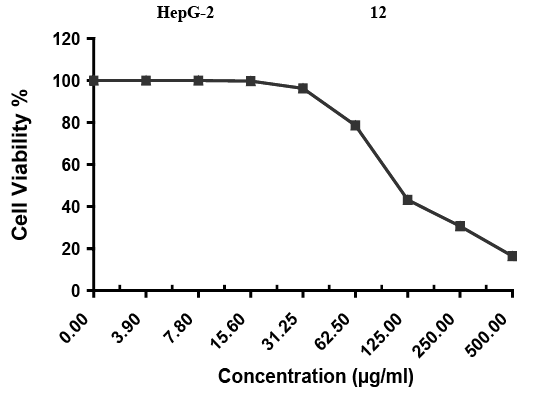
Figure 2
Evaluation of cytotoxicity against HepG-2 cell line; Inhibitory activity against Hepatocellular carcinoma cells was detected under these experimental conditions with IC50 = 113 ± 3.7 µg/ml.

Figure 3
HepG cells treated with A. fumigatus extract at 10µg (A); at 100µ g (B).
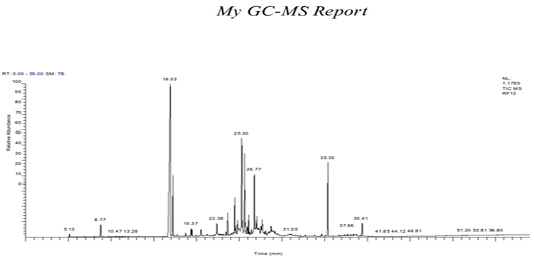
Figure 4
GC-Mass of A. fumigatus extract.


