Advances in Animal and Veterinary Sciences
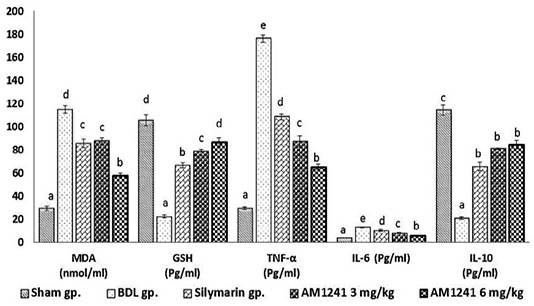
Effect of CB2- activator AM1241 on hepatic tissue homogenate of oxidative stress markers, TNF-α, IL-6 and IL-10 in bile duct ligation model. N=9; Values are expressed as mean ± SE. Data were analyzed by using one-way ANOVA followed by Tukey post-hoc test, a, b, c, d and e are significant at P < 0.05.
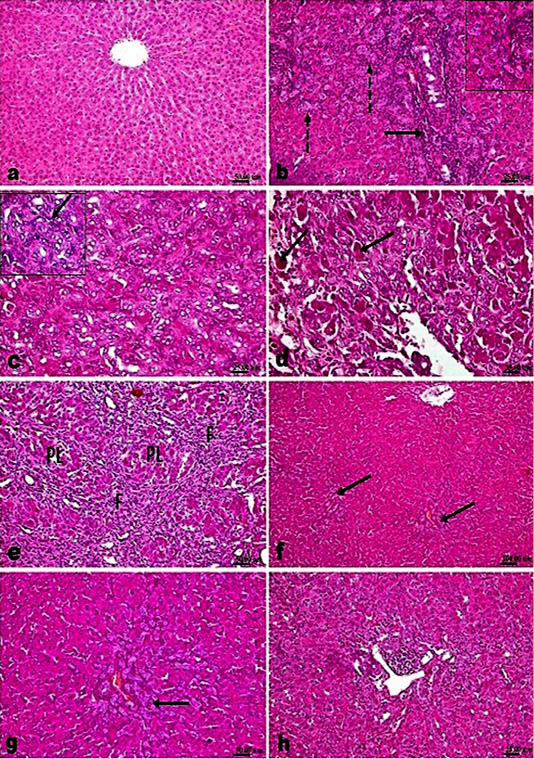
H and E stained sections; AM1241 interfered the progress of hepatic fibrosis associated with bile duct ligation (BDL); (a) Liver of control rat showing normal histological structure. (b-e). Liver of BDL rat showing; (b) marked proliferation of the bile duct epithelium with many newly formed bile ducteols (dashed arrows) and mononuclear inflammatory cells infiltration (arrow); (c) insinuation of the proliferated cholangiocytes among the parenchymal cells accompanying proliferated oval cells (arrow); (d) many apoptotic bodies and cells (arrow); (e) fibroplasia (F) with marked pseudolobulation (PL) of the hepatic parenchyma; (f and g) Liver of BDL rat that treated with Silymarin showing mild portal fibroplasia, moderate cholangiocytes’ proliferation and multiple newly formed bile ducteols (arrow); (h) Liver of BDL rat that treated AM1241 (3mg/kg bwt) showing marked decreased cholangiolar epithelial proliferation and few portal inflammatory cells infiltration.
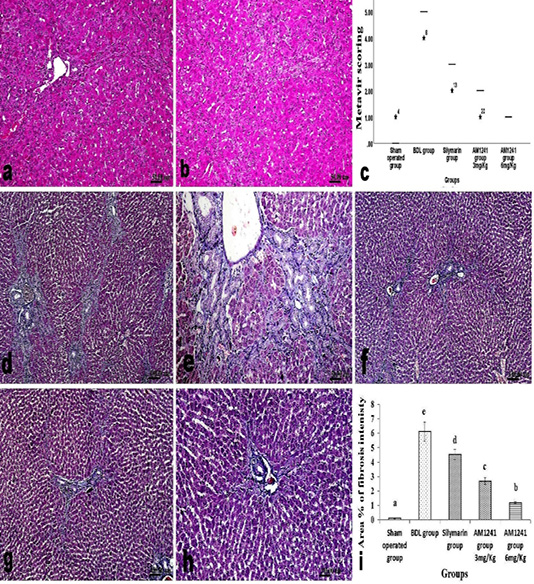
a and b; H and E stained liver sections of BDL rats that treated AM1241 (3 and 6mg/kg b wt, respectively) showing; (a) very mild portal fibroplasia without any evidence of peripheral extension; (b) explicit hepatic lobular regularity preservation; (c) Metavir scoring for fibrosis extension in control, BDL and different treated groups; (d- h) Masson’s Trichrome stained liver sections; (d and e) BDL rat showing accretion in hepatic fibrous components in portal triads and peripherally; (f) silymarin administration to BDL rats reduced fibrous tissue proliferation; (g and h) AM1241 administration to BDL rats significantly decreased fibrous tissue proliferation. (i) The intensity of fibrous proliferation in different groups evaluated by image analysis software (Image J, 1.46a, NIH, USA).
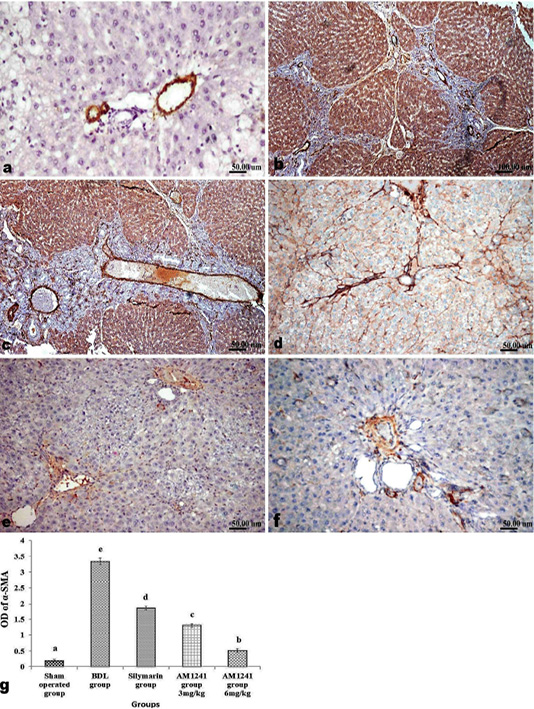
Immunohistochemical analysis of α-SMA; (a) control rat showing normal positive α-SMA expression around portal vein; (b and c) BDL rat showing increased expression of α-SMA in the portal areas and along the fibrous tissue proliferation; (d) decreased expression of α-SMA in silymarin treated rat; (e and f) marked limitation of α-SMA expression in AM1241 (3 and 6mg/kg b wt,) administrated rats; (g) Quantitative image analysis of α-SMA positive brown color in 5 microscopic fields (the area for each microscopic field is 18.8913Sqmm). Values are expressed as mean ± SE. Data were analyzed by using one way ANOVA followed by Tukey post-hoc test, a, b, c, d and e are significant at P < 0.05.
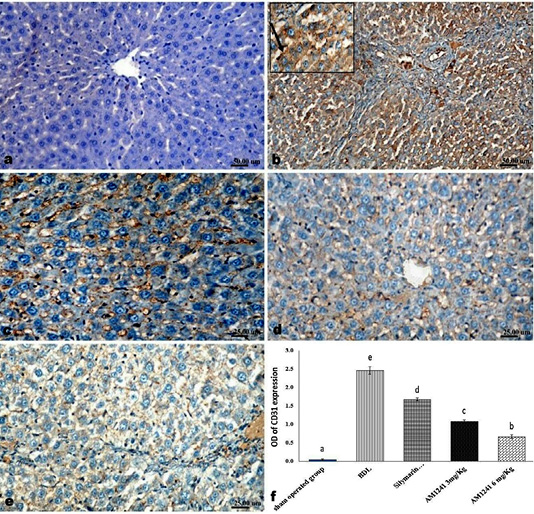
Immunohistochemical analysis of CD31; (a) control rat showing negative immune-expression of CD31; (b) BDL rat showing increased CD31 immune-reactive cells among the sinusoidal endothelial linings (c) decreased expression of CD31 in silymarin treated rat; (d and e) marked decreased expression of CD31 in AM1241 (3 and 6mg/kg b wt,) administrated rats; (f) Quantitative image analysis of CD31 expression in 5 microscopic fields (the area for each microscopic field is 18.8913Sqmm). Values are expressed as mean ± SE. Data were analyzed by using one way ANOVA followed by Tukey post-hoc test, a, b, c, d and e are significant at P < 0.05
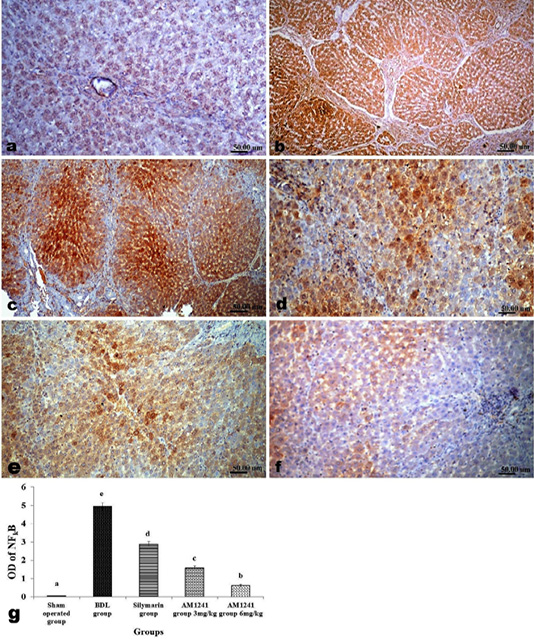
Immunohistochemical analysis of NF-κB; (a) control rat showing negative immune-expression of NF-κB; (b and c) BDL rat showing increased NF-κB among the hepatic parenchymal cells; (d) decreased expression of NF-κB in silymarin treated rat; (e and f) significant decreased expression of NF-κB in AM1241 (3 and 6mg/kg b wt,) administrated rats; (g) Quantitative image analysis of NF-κB expression in 5 microscopic fields (the area for each microscopic field is 18.8913Sqmm). Values are expressed as mean ± SE. Data were analyzed by using one way ANOVA followed by Tukey post-hoc test, a, b, c, d and e are significant at P < 0.05.
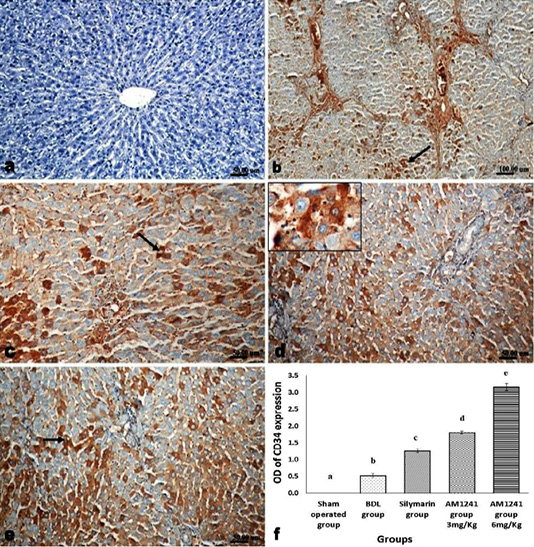
Immunohistochemical analysis of CD34; (a) control rat showing negative immune-expression of CD34; (b) BDL rat showing mild immunopositivity of CD34; (c) increased immune expression of CD34 in silymarin treated rat; (d and e) marked dose related increased CD34 immune-positive cells in AM1241 (3 and 6mg/kg b wt,) administrated rats; (f) Quantitative image analysis of CD34 expression in 5 microscopic fields (the area for each microscopic field is 18.8913Sqmm). Values are expressed as mean ± SE. Data were analyzed by using one way ANOVA followed by Tukey post-hoc test, a, b, c, d and e are significant at P < 0.05.


