Advances in Animal and Veterinary Sciences
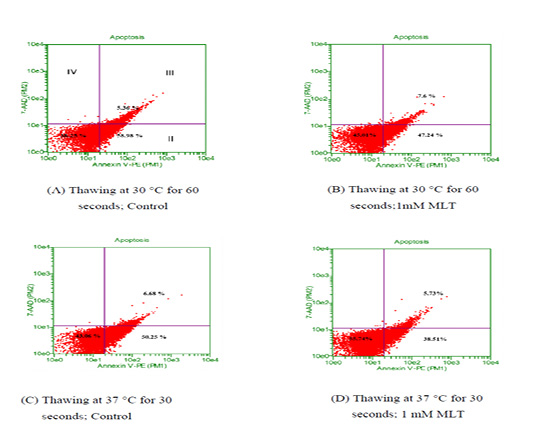
Flow cytometry dot plot for apoptosis analysis
Thawing at (A-B) 30 °C for control and treatment group ;(C-D) 37 °C control and treatment group. Events in the lower-left quadrant represent annexixn V –ve/7AAD –ve spermatozoa (viable sperm), and events in the lower-right quadrant represent early apoptotic spermatozoa (annexin V +ve /7AAD -ve). Spermatozoa in the upper-right quadrants represent late apoptotic/dead cells (annexin V+ve /7AAD +ve)
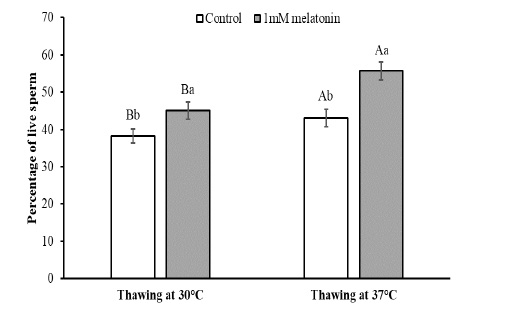
Effect of melatonin and thawing temperature on the percentage of sperm livability
The data expressed as Mean ± SEM. Different letters in each bar represent statistically significant differences (p < 0.01) where (a, b) represent difference between treatment groups and (A, B) represent difference between thawing groups.
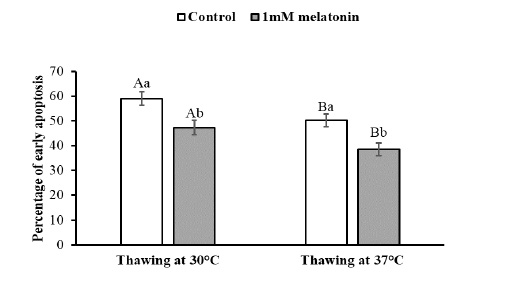
Effect of melatonin and thawing temperature on the percentage of early apoptosis
The data expressed as Mean ± SEM. Different letters in each bar represent statistically significant differences (p < 0.01) where (a, b) represent difference between treatment groups and (A, B) represent difference between thawing groups.


