Advances in Animal and Veterinary Sciences
Research Article

Use of Data Mining Algorithms Chaid and Cart in Predicting Egg Weight from Egg Quality Traits of Indigenous Free-Range Chickens in Zambia
Simushi Liswaniso1,2,3, Ning Qin1,2,Thobela Louis Tyasi4, Ignatius Musenge Chimbaka1,2, Xue Sun1,2, Rifu Xu1,2*
1College of Animal Science and Technology, Jilin Agricultural University, Changchun 130118, China; 2Joint Laboratory of Modern Agricultural Technology International Cooperation, Ministry of Education, Jilin Agricultural University, Changchun 130118, China; 3Department of Livestock Development, Mulungushi House. Lusaka. The Republic of Zambia; 4Department of Agricultural Economics and Animal Production, University of Limpopo, Polokwane. Limpopo Province, South Africa.
Abstract | This study aimed to evaluate the performance of data mining algorithms Chi-square Automatic Interaction Detector (CHAID) and Classification And Regression Tree (CART) in predicting egg weight from different egg quality traits such as egg length (EL), egg width (EW), shell weight (SW), shell thickness (ST), albumen weight (AW), yolk height (YH), yolk width (YD) and yolk weight (YW). To attain this, 364 indigenous free-range chicken eggs were employed. The goodness of fit test was done to compare the predictive performance of these algorithms. Pearson correlation coefficient between the egg weight and the predicted egg weights was found to be 0.907 (P < 0.01) for the CHAID algorithm. Coefficient of determination (R2), Adjusted R2 (Adj-R2), Root Mean Square Error (RMSE), Relative approximation error (RAE), standard deviation ratio (SD ratio) for the CHAID algorithm were estimated to be 0.823, 0.823, 2.23, 0.04, and 0.23 correspondingly. Pearson correlation coefficient between the egg weight and the predicted egg weights was found to be 0.771 (P < 0.01) for the CART algorithm. The R2, Adj-R2, RMSE, RAE, SD ratio for the CART algorithm were estimated to be 0.593, 0.593, 2.32, 0.07, and 0.24 correspondingly. Given its stronger prediction accuracy (R2), lower values of RMSE, and RAE, the CHAID algorithm can be recommended for analysis of egg quality traits of free-range indigenous chickens.
Keywords | Egg weight, Egg quality traits, Indigenous free-range chickens
Received | September 12, 2020; Accepted | September 27, 2020; Published | January 01, 2021
*Correspondence | Rifu Xu, College of Animal Science and Technology, Jilin Agricultural University, Changchun 130118, China; Email: poultryjlau@163.com
Citation | Liswaniso S, Qin N, Tyasi TL, Chimbaka IM, (2021). Use of data mining algorithms chaid and cart in predicting egg weight from egg quality traits of indigenous free-range chickens in zambia. Adv. Anim. Vet. Sci. 9(2): 215-220.
DOI | http://dx.doi.org/10.17582/journal.aavs/2021/9.2.215.220
ISSN (Online) | 2307-8316; ISSN (Print) | 2309-3331
Copyright © 2021 Xu et al. This is an open access article distributed under the Creative Commons Attribution License, which permits unrestricted use, distribution, and reproduction in any medium, provided the original work is properly cited.
INTRODUCTION
Other than being a reservoir of nutrition for the embryo still developing, eggs are a well-known source of proteins to mankind (Sun et al., 2019). Egg quality traits are attributes of eggs that affect the overall quality of the egg, chief among them is egg weight. The main contributors to egg weight are eggshell (11%), egg yolk (31%), and albumen (58%) (Abanikannda and Leigh, 2007). Several factors have been documented to affect the quality traits of eggs which in turn affects the quality and market price of eggs. These have been identified as the reproduction cycle, age of hen laying, genetic composition, nutrition the of hen, and management practices (Amao and Olugbemiga, 2016; Bagh et al., 2016; Khan et al., 2014; Silversides et al., 2001).
Egg traits of Zambian free-range chickens have been identified to be of an inferior standard to their commercial counterpart despite possessing a huge potential for improvements with proper breeding (Liswaniso et al., 2020a). The overall purpose of animal breeding is to produce offspring that are genetically superior to their parent generations. This is done to maintain or improve production and productivity under the expected conditions of production. This improvement of the genetic potential of a particular population is attained by the selection of the best-performing animals for a particular trait to be parents of the next generation (Olfaz et al., 2019).
In making decisions for selection to improve desired traits, breeders deal with a lot of data consisting of a lot of factors which in most cases renders the data multidimensional. With more parameters being studied comes more complications in the data for breeders to interpret and make sense of (Olfaz et al., 2019; Liswaniso et al., 2020b). At this stage making mistakes leading to the design of ineffective breeding programs becomes unavoidable. Several studies have made use of linear regression to study the relationships between traits of economic importance such as egg traits. Regression mainly relies on the linearity of the relationship between traits under consideration. And a lot of studies have been done to establish the interrelations between traits of economic importance and egg weight is correlated highly with various egg trait characteristics (Yakubu et al., 2008; Abanikannda and Leigh, 2007; Ojedapo, 2013). An alternative to linear regression is the use of data mining techniques a method that has gained so much momentum in animal science recently. Data mining is the use of computer-based methods to discover information from data (Kantardzic, 2011). Decision tree methods have been preferred due to the advantages they possess in multicollinearity, missing data, and with no supposition on the spreading of independent variables (Mendeş and Akkartal, 2009).
This is not the first time that data mining algorithms are being employed to analyze genetic potential existent in animal populations. Data mining algorithms were exploited to guesstimate cold carcass weight and body weight from diverse biometric linear dimensions (Karabacak et al., 2017), to estimate egg weights of quail eggs from some internal and external egg characteristics (Çelik et al., 2017), to assess egg quality characteristics influencing fertility in the eggs of Japanese quails (Çelik et al., 2016). In sheep, CHAID and CART algorithms were used in Karayaka sheep breeding (Olfaz et al., 2019). Data mining has also been used in dairy to analyze factors affecting the first lactation milk yield (Mikail and Bakır, 2019). The CART algorithm was used by Tyasi et al. (2020) to proximate chicken body weight from their linear body biometric traits. However, in the evaluation of four dissimilar data mining algorithms, Ali et al. (2015) presented goodness of fit benchmarks for valuation of body weight using some morphological traits.
With so much available literature on the use of data mining algorithms in the analysis of data in animal science, there is yet to be available information with regards to the utilization of data mining to scrutinize indigenous free-range chicken eggs for selection and breeding. This is why this study was conducted to employ the CHAID and CART algorithms to generate decision trees that would establish principal influencers of egg weight. We also aimed at establishing which algorithm would be recommended in selecting for egg weight improvements between CART and CHAID algorithm.
materials and METHODS
This study was conducted in Lusaka, Zambia. 364 eggs of free-range indigenous chicken were collected from Lusaka, Zambia for this study. The egg traits were measured as described previously (Liswaniso et al., 2020a).
In both the CART and CHAID model, egg length (EL), egg width (EW), shell weight (SW), shell thickness (ST), albumen weight (AW), yolk height (YH), yolk width (YD) and yolk weight (YW) were exploited as independent variables to foretell egg weight (EW). Nonetheless, only expressively meaningful variables were taken along in the tree regression model.
There are three data mining algorithms in SPSS statistical software and in this study we used CART and CHAID. These have been established to be suitable to substantiate the relationship among scale-dependent variables and numerous independent variables that may comprise both scale and categorical structure.
In the CHAID Algorithm, a prediction model is established to define how variables best combine to describe the outcome in a given dependent variable. In CHAID, continuous prognosticators are divided into categories that have approximately alike number of observations. In CHAID analysis, ordinal data Continuous and nominal data can be used. CHAID analyses non-binary data by fragmenting independent variables into clusters centered on the chi-square statistic. CHAID Clusters populations into subgroups such that variation in a dependent variable in the group is minimized while maximizing variations between groups (Ratner, 2003; Dogan, 2003). In the Classification and Regression tree (CART), there is DATA splitting into subgroups that are as uniform as there can be with regards to the reliant variable (Mikail and Bakır, 2019).
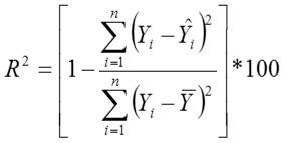
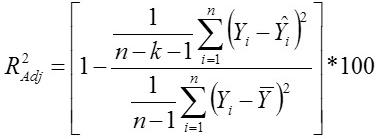
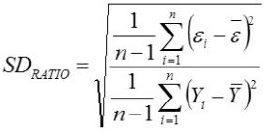
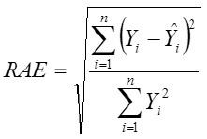
To establish which algorithm was the best between the CART and CHAID algorithm, we used SPSS 23 to determine the goodness of fit. The following formulae were used as criteria for quality as prescribed by (Grzesiak and Zaborski, 2012)
Coefficient of Determination
Adjusted Coefficient of Determination
Standard Deviation Ratio
Relative Approximation Error (RAE)
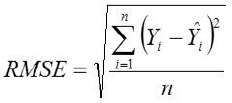
Root Mean Square Error
Where,
Yi, the actual Egg weight (g) of the ith egg; Ŷi, the predicted egg weight value of ith egg; Ȳ, average of the actual egg weight the ith egg; Ɛi, the residual value of ith egg; έ average of the residual values; k, number of significant independent variables in the model; and n, the total number of eggs. The residual value of each egg is expressed as Ɛi= Yi - Ŷi.
RESULTS AND DISCUSSION
Despite much literature being available on the use of data mining algorithms, there is still yet to be enough literature on the use of these methods in indigenous free-range chicken eggs. And so, this study aimed at using CHAID and CART algorithms to estimate the egg weight of indigenous free-range chickens. Also to assess which of the two data mining algorithms would be recommended for use in breeding for egg production in free-range chickens.
Figure 1 shows a regression tree generated by the CHAID algorithm for the estimation of egg weight from a variety of variables, egg length, egg width, shell thickness, shell weight, albumen weight, yolk height, yolk weight, and yolk width factors. A look into the decision tree generated by the CHAID algorithm depicts the shell weight as a principal factor influencing the egg weight trait (Adj. P-value =0.00, F=417.327, df1=4, df2=359). In the second level of influencers of egg weight was found to be egg width and albumen weight. The third line of influencers had shell thickness and yolk weight.
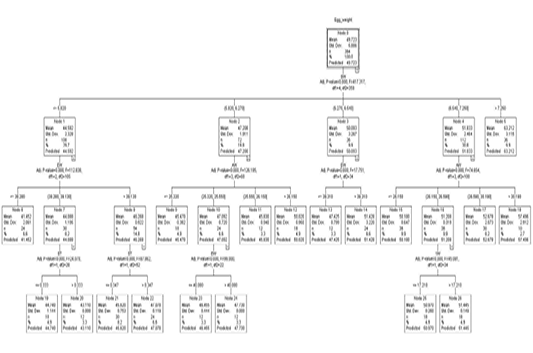
Figure 1: The decision tree generated by CHAID
The overall egg weight was estimated to be 49.723 g (S=5.886) in node 0 where 364 eggs were present in the top section of the CHAID generated decision tree. Node 0 which was the root node subdivided all the eggs into 5 subgroups based on their shell weight. The egg weight by order was node 1 < node 2 < node 3< node 4< node 5.
Node 1 was the first subgroup (n=108) with eggs of shell weights less or equal to 5.820 g. These had a mean weight of 44.592 g and S=2.328. Node 2 comprised eggs with 5.820 g <shell weight ≤ 6.270 g. These had an estimated weight of 47.208 g (S= 1.911). By number, 72 eggs were in this category. Node 3 with a mean egg weight of 50.093 g (S= 3.267) comprised the third subgroup of eggs with eggshell weight in the range of 6.270 g <shell weight ≤ 6.540 g. Eggs with eggshell weight in the range 6.540 g <shell weight ≤7.250 g comprised node 4. These had 112 eggs with a predicted egg weight of 51.833 g (S= 2.464). Eggs with an eggshell weight greater than 7.250 g comprised node 5. 36 eggs belonged to node 5 and had a mean weight of 63.212 g (S=3.115).
Node 1 was subdivided into 3 subgroups based on their egg width (Adj. p-value=0.000, F=112.838, df1=2 and df2=105). The three (3) division comprised of nodes 6, 7, and 8. Eggs with an egg width of less than 38.280 mm were grouped in node 6. Eggs in node 6 were 24 by number with a predicted weight of 41.452 g (S=2.061). Eggs with an egg width of 38.280 mm < egg width ≤ 39.130 comprised node 7 with a mean/predicted weight of 44.088 g and S value of 1.195. Node 7 had 30 eggs. Node 8 was the last of the subdivision in node 1. It comprised eggs that had an egg width greater than 39.130 mm. The 54 eggs in node 8 had a mean egg weight of 46.268 g (S=0.922). Node 7 was further subdivided into two nodes based on shell thickness (Adj. p-value=0.000, F=24.07, df1=1, df2=28). Eggs with less or equal to 0.333 mm in shell thickness belonged to node 19 with a predicted Egg weight of 44.740 g (S=1.144). This node had 18 eggs. The 30 eggs with a shell thickness thicker than 0.333 mm from among those in node 7 composed node 20 which had a mean weight of 43.110 g. Node 8 saw a subdivision into two subgroups based on shell thickness (Adj. p-value=0.000, F=87.862, df1=1, and df2=52). Eggs with shell thickness ≤ 0.347 mm formed the cluster in node 21. Node 21 had a group of 30 eggs with a mean weight of 45.620 g. Eggs with an shell thickness greater than 0.347 mm comprised node 22 which had 24 eggs with a mean weight of 47.078 g.
Node 2 was further subdivided into nodes 9, 10, 11, and 12 based on albumen weight (Adj. p-value=0.000, F=126.195, df1=3, df2=68). The subdivisions were ≤25.320 g, 25.320 g <albumen weight ≤25.550 g, 25.550 g <albumen weight ≤26.150 g and >26.150 g for node 9 (n=18), node 10 (n=24), node 11 (n=12) and node 12 (n=18) showing predicted weights of 45.470 g (S=0.382), 47.092 g (S=0.720), 45.830 g (S=0.940), and 50.020 g (S=0.950) correspondingly. Based on egg width, node 10 was split into two nodes, node 23 (EW ≤ 40.080) and node 24 (EW > 40.080). Node 23 had 12 eggs with a mean weight of 46.455 g (S=0.444) and 47.730 g (S=0.00) for node 23 and node 24 respectively.
Out of node 3 two subdivisions are born based on egg width (Adj. p-value=0.000, F=17.751, df1=1, df2=34). Eggs less or equal to 39.310 mm in width formed node 13 with 12 eggs that had a predicted weight of 47.425 g (S=0.799). Node 14 had all the eggs with egg width higher than 39.310 mm which had 24 eggs with a predicted weight of 51.424 g (S=3.220).
Out of node 4 based on albumen weight, were 4 subdivision (Adj. p=0.000, F=74.654, df1=3, df2=108). These nodes classifications were ≤26.150 g (node 15), 26.150 g <albumen weight ≤ 26.590 g (node 16), 26.590 g <albumen weight ≤ 30.190 g (node 17) and >30.190 g (node 18) exhibiting predicted weights of 50.180 g (S=0.647), 51.208 g (S=0.319), 52.678 g (S=2.073) and 57.496 g (S=2.912) respectively. Node 16 was subdivided based on yolk weight (Adj. p=0.000, F=45.081, df1=1, df2=34). Eggs with yolk weight ≤17.210 g comprised node 25 which had 18 eggs with a predicted weight of 50.970 g (S=0.260). Node 26 (n=18) had eggs of yolk weight more than 17.210 g which had a mean weight of 51.445 g (S=0.149).
Because nodes 5, 6, 9, 11, 12, 13, 14, 15, 17, 18, 19, 20, 21, 22, 23, 24, 25 and 26 are terminal nodes, no partition was observed for providing homogeneousness in these nodes.
The regression tree constructed by the CART algorithm revealed that the egg length was the premier influencer of egg weight (Figure 2). Other identified impactors at other levels were egg width, yolk width, albumen weight, shell thickness, and shell weight. In the first depth, node 0 predicted an overall weight of 49.723g (S=5.886). Node 0 was subdivided based on egg length into node 1 (eggs less or equal to 57.820 mm) and node 2 (eggs with egg length more than 57.820 mm).
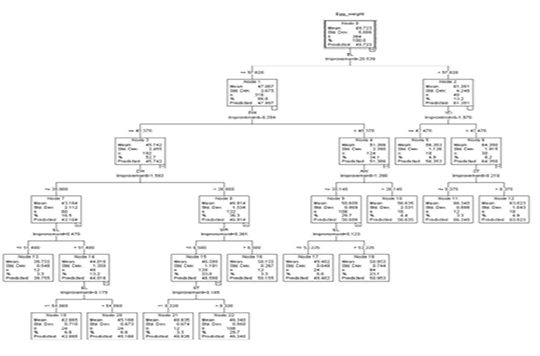
Figure 2: The decision tree generated by CART
Node 1 was split into node 3 and node 4 based on egg width. Eggs with egg width less or equal to 40.370 mm (n=192) and those with egg width greater than 40.370 mm (n=124). These had predicted weights of 45.742g (S=2.455) and 51.386 g (S=2.390) respectively.
Based on egg width, node 3 was split into 2 nodes. Those with egg width less or equal to 38.980 mm (node 7, n= 60) and those with egg width larger than 38.980 mm (node 8, n=132). The predicted weights for nodes 7 and 8 were 43.164 g (S=2.112) and 46.914 g (S=1.534) respectively. Eggs in node 7 were further subdivided into eggs with egg length less or equal 51.480 mm and those with egg length more than 51.480mm to form node 13 and node 14 which had predicted weights of 39.755g (S=0.548) and 44.016 g (S=1.360) respectively. From node 14 was born nodes 19 and node 20 based on egg length with 24 eggs in each node having a predicted weight of 42.865g (EL ≤54.060 mm) and 45.168 (EL >54.060 mm) correspondingly.
Node 8 was split based on shell weight to form node 15 (SW ≤ 6.580 g, n=120) and node 16 (SW > 6.580 g, n=12). These had predicted weights of 46.590 g (S=1.191) and 50.155 (S=0.287) for node 15 and node 16 respectively.
Table 1: Comparison Criteria for CHAID and CART.
| Algorithm | r |
R2 |
Adj-R2 |
RMSE | RAE | SD ratio |
| CHAID | 0.907 | 0.823 | 0.823 | 2.23 | 0.04 | 0.23 |
| CART | 0.771 | 0.593 | 0.593 | 2.32 | 0.07 | 0.24 |
Where r = correlation coefficient between egg weight and predicted weight, R2 = coefficient of determination, Adj-R2 = Adjusted Coefficient of Determination, RMSE = Root Mean Square Error, RAE = Relative Approximation Error, SD ratio = Standard Deviation ratio
Node 15 was further subdivided based on shell thickness into node 21 (ST ≤ 0.320 mm, n=12) and node 22 (ST > 0.320 mm, n=108). These had a predicted weight of 48.835 g (S=0.674) and 46.340g (0.950).
Node 4 based on albumen weight was subdivided into node 9 (AW ≤ 30.145 g, n=108) and node 10 (AW > 30.145 g, n=16) with mean weights of 50.609 g (S=0.969) and 56.635 g (S=2.531) respectively. Node 9 has was further split based on egg length into node 17 (EL ≤ 53.335mm) and node 18 (EL > 53.335mm) with predicted weights of 49.402 (S=0.649) and 50.954g (S=0.744) correspondingly.
Node 2 was split based on yolk width into node 5 (YD ≤ 42.470 mm, n=18), and node 6 (> 42.470 mm, n=30). Eggs in node 5 had a predicted weight of 56.353 g (S=1.126) and node 6 which was split further into node 11 and node 12 based on shell thickness had a predicted weight of 64.350 g (S=1.915). Node 11 (n=12) and node 12 (n=18) had predicted weights of 66.340g (S=0.888) and 63.023g (S=1.043) respectively.
Nodes 5, 10, 11, 12, 13, 16, 17, 18, 19, 20, 21, and 22 were terminal as no partition was observed for providing homogeneousness in these nodes.
In this study, our results showed that the separation of the first node (node 0) was based on egg length in the CART algorithm-generated regression tree and was based on the eggshell weight in the CHAID generated regression tree. This is an indication that the predictor of egg weight was dependent on the stated algorithm. The CHAID algorithm engendered a three-level branching tree while the CART algorithm created a tree with five levels of branching. It therefore can be hypothesized here that the CHAID algorithm could be interpreted much easier. This hypothesis stands akin to the finding of other similar studies (Olfaz et al., 2019; Ali et al., 2015).
Table 1 shows the goodness of fit results. Pearson correlation coefficient between the egg weight and the predicted egg weights was found to be 0.907 (P <0.01) for the CHAID algorithm. The R2, Adj-R2, RMSE, RAE, SD ratio for the CHAID algorithm were estimated to be 0.823, 0.823, 2.23, 0.04, and 0.23 correspondingly. Pearson correlation coefficient between the egg weight and the predicted egg weights was found to be 0.771 (P <0.01) for the CART algorithm. The R2, Adj-R2, RMSE, RAE, SD ratio for the CART algorithm were estimated to be 0.593, 0.593, 2.32, 0.07, and 0.24 correspondingly.
Given the stronger prediction accuracy (R2), lower values of RMSE and RAE exhibited by the CHAID predicted algorithm compared to the CART algorithm, the CHAID algorithm can be recommended for use in the analysis of egg quality traits as well as to estimate egg weight from quality traits of free-range indigenous chickens.
ACKNOWLEDGeMENT
This work was supported by the Project of National Natural Science Foundations of China (No.31672407, No.31272431), Science and Technology Development Plan of Jilin Province (No. 20170101019JC), China Agriculture Research System (No. CARS-41), and Project of Education Development Plan of Jilin Province (No. JJKH20180646KJ). Gratitude also goes to Ms. F. Chiyengo and Ms. R. Chisenga for the support during data collection.
conflict of interest
The authors have declared no conflict of interest.
Authors contrbution
SL collected the data, analyzed it and wrote the manuscript. NQ, and TLT analyzed the data and wrote the manuscript. IMC and XS wrote the manuscript. RX designed and supervised the study, and approved the final draft of the manuscript.
REFERENCES


