Advances in Animal and Veterinary Sciences
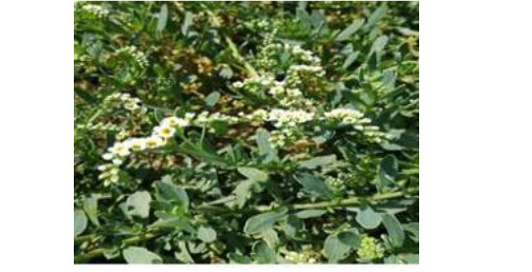
Photograph of H. curassavicum.
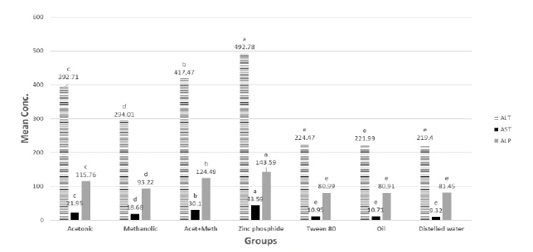
ALT (U/ml), AST (U/ml) and ALP (U/ml) in tested extracts and zinc phosphide compared to control groups.
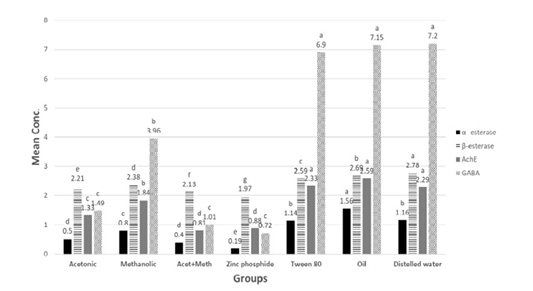
α –esterase (µg phenol/ml), β-esterase (µg phenol/ml), AchE (ng/ml) and GABA (mumol/L) in tested extracts and zinc phosphide compared to control groups.
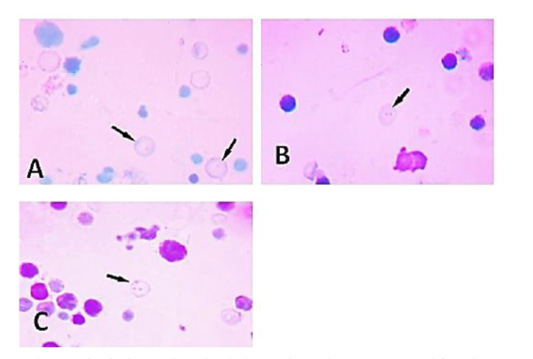
A micrograph of micronucleated polychromatic erythrocytes prepared from bone marrow cells of adult male rats treated showing variation in their number: (A) Single micronucleus. (B) Bi-micronuclei. (C) Multi-micronuclei.
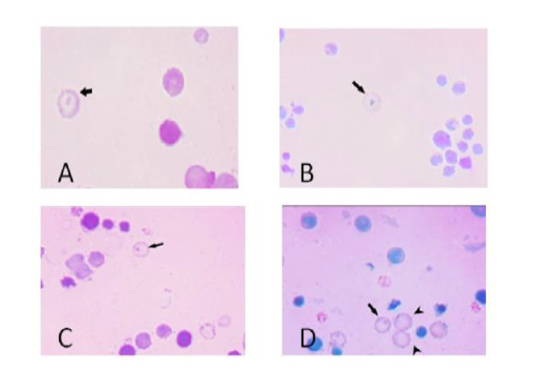
A micrograph of micronucleated polychromatic erythrocytes prepared from bone marrow cells of adult male rats treated showing variation in their number (A) Almond shape (B) Rounded mass. (C) Rod-like structure. (D) Dot-like structure
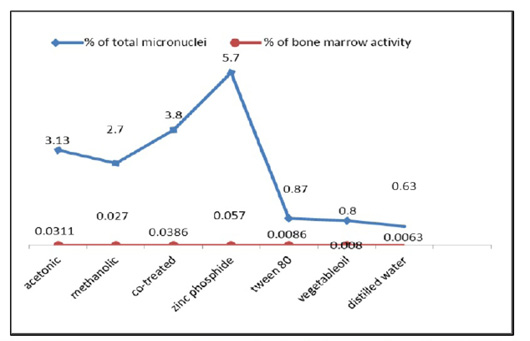
The frequency percentages of micronucleated polychromatic erythrocytes (MNPCEs) and the bone marrow activity from the bone marrow cells of control and treated animals.
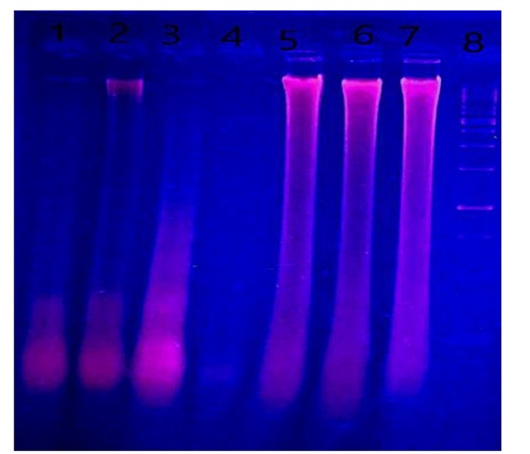
DNA fragmentation in liver of male albino rats orally administrated with H. curassavicum acetonic, methanolic, mixture of both extracts once daily at dose (625 and 825 mg/kg b.wt.), respectively and zinc phosphide at dose (5 mg/kg b.wt.) for 28 days. Lane 1: group treated with acetonic extract. Lane 2: group treated with methanolic extract. Lane 3: co-treated group. Lane 4: group treated with zinc phosphide. Lane 5: control group treated with tween 80, Lane 6: control group treated with vegetable oil, Lane 7: control group treated with distilled water. Lane 8: ladder.
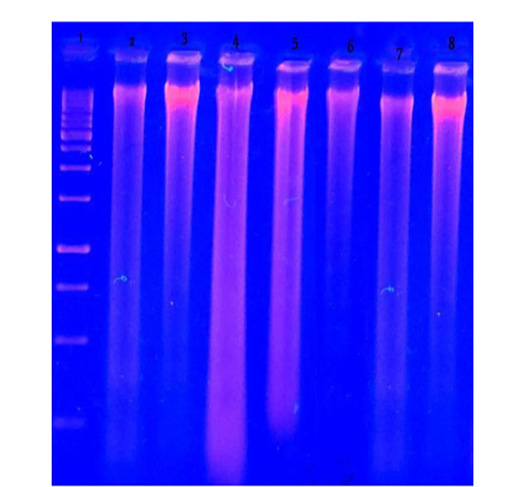
DNA fragmentation in brain of male albino rats orally administrated with H. curassavicum acetonic, methanolic, mixture of both extracts once daily at dose (625 and 825 mg/kg b.wt.) respectively and zinc phosphide at dose (5 mg/kg b.wt.) for 28 days. Lane 1: ladder. Lane 2: group treated with acetonic extract. Lane 3: group treated with methanolic extract. Lane 4: co-treated group. Lane 5: group treated with zinc phosphide. Lane 6: control group treated with tween 80. Lane 7: control group treated with vegetable oil. Lane 8: control group treated with distilled water.
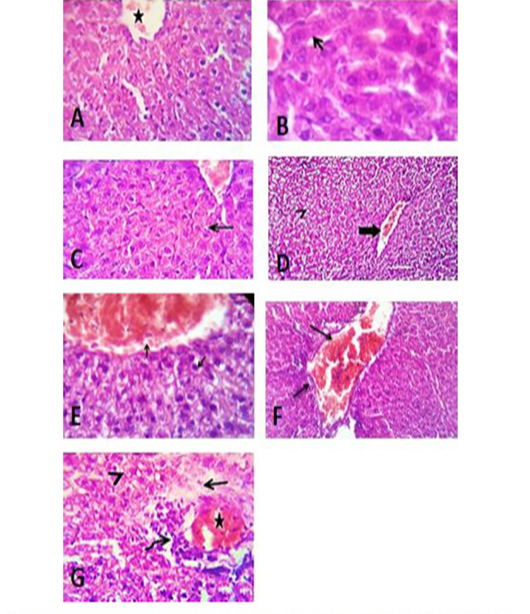
Liver sections of control group of tween 80 (A), vegetable oil (B) and distilled water (C) showing normal histological structure. (D) Photomicrograph of liver section of group treated with acetonic extract of H. curassavicum at dose (625 mg/kg b.wt.) for 28 days, revealed mild congestion of hepatic blood vessels (thick arrow) and degenerative changes in moderate number of hepatocytes (arrow head). (E) Photomicrograph of liver section of group treated with methanolic extract of H. curassavicum at dose (825 mg/kg b.wt.) for 28 days, showed congestion of hepatic blood vessels and degenerative changes in a moderate number of hepatocytes (arrows). (F) Photomicrograph of liver section of group treated with both acetonic and methanolic extracts of H. curassavicum at dose (625 and 825 mg/kg b.wt.), respectively for 28 days revealed severely congested portal blood vessels, portal lymphocytic infiltration and biliary hyperplasia (arrows). (G) Photomicrograph of liver section of group treated with zinc phosphide at dose (5 mg/kg b.wt.) for 28 days, showed moderate congestion of the hepatic blood vessels (stars), perivascular edema (arrow), round cells infiltration (curved arrow) and hydropic degeneration in large number of hepatocytes (arrow head). H&E. X 400.
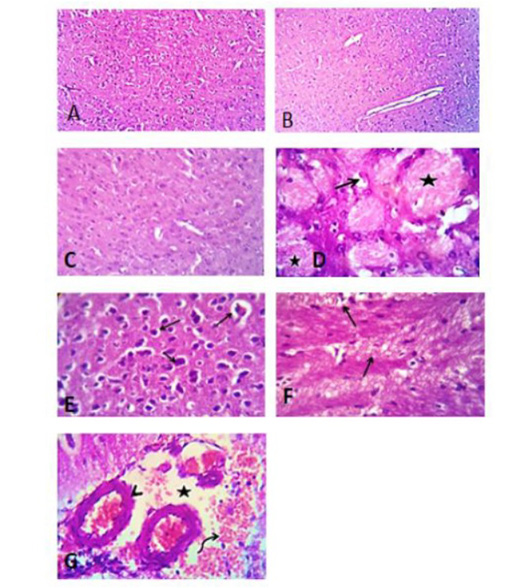
Photomicrograph of brain section of control groups treated with tween 80, vegetable oil and distilled water for 28 days showing apparently normal brain tissue (A), (B) and (C), H&E. X 100. (D) Photomicrograph of brain section of group treated with acetonic extract of H. curassavicum at dose (625 mg/kg b.wt.) for 28 days, revealed focal neuronal degeneration (open arrow) and coagulative necrosis of some axons (stars). (E) Photomicrograph of brain section of group treated with methanolic extract of H. curassavicum at dose (825 mg/kg b.wt.) for 28 days, showed Perivascular and perineural edema beside degeneration of moderate number of neurons in the cerebral cortex (arrows). (F) Photomicrograph of brain section of group treated with both acetonic and methanolic extracts of H. curassavicum at dose (625 and 825 mg/kg b.wt.), respectively for 28 days revealed perivascular edema, focal gliosis (open arrow) beside axonal degeneration and demylination (closed arrows). (G) Photomicrograph of brain section of group treated with zinc phosphide at dose (5 mg/kg b.wt.) for 28 days, showing perivascular edema (stars) and hemorrhage (curved arrow). The lateral ventricles showing dilatation with edema and congestion of the choroid plexuses (arrow heads). H&E. X 400.


