Advances in Animal and Veterinary Sciences
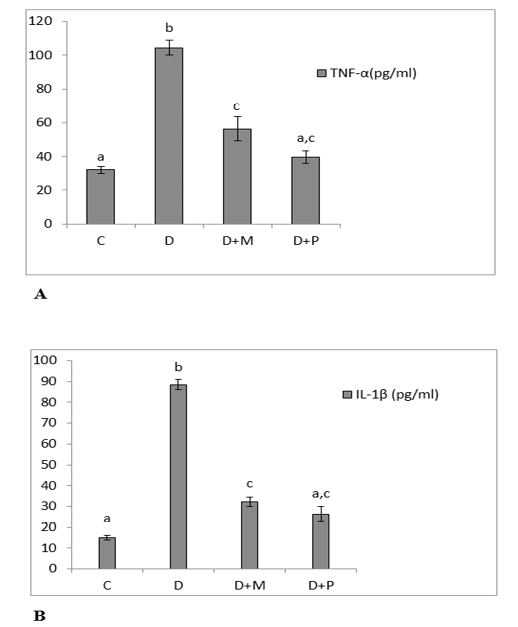
(A) Serum levels of TNF-α. (B): Serum levels of IL-1β in the various studied rat groups. Values are represented as mean ± standard error of mean.
The different superscript letters mean a significant difference at (P> 0.05) between different groups. Group C: control, Group D: diclofenac sodium, Group (D+M): diclofenac sodium & MO, Group (D+P): diclofenac sodium & propolis.
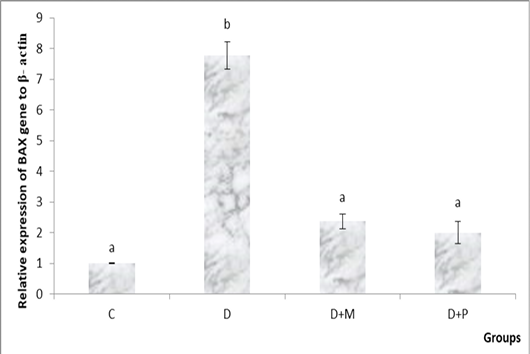
Relative expression levels of BAX gene in the various studied rat groups. The different superscript letters mean a significant difference at (P> 0.05) between different groups. Group C: control, Group D: diclofenac sodium, Group (D+M): diclofenac sodium & MO, Group (D+P): diclofenac sodium & propolis.
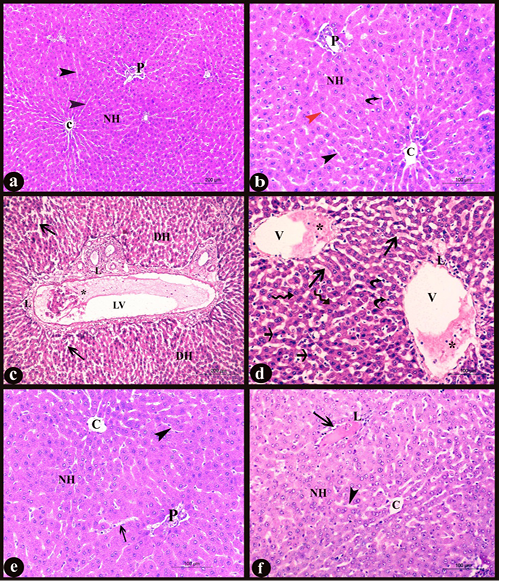
Sections in liver of albino rat showing the histopathological changes a-b) Control liver, c-d) Rat liver of D group, e) Rat liver of D+M group and f) Rat liver of D+P group. Notice, normal central vein with intact lining (C), normal portal area (P), normal polyhedral hepatocytes with rounded vesicular nuclei forming hepatic plates (NH), normal hepatic sinusoids (black arrowheads), endothelial cells (red arrowhead), Von kupffer cells (curved arrows), degenerated hepatic cells (DH), dilated and congested lymphatic vessel (LV), desquamated cells and inflammatory cells infiltration (*), diffuse lymphocytic infiltration (L), dilated and congested hepatic sinusoids (long arrows), dilated and congested central vein (V), swollen hepatocytes with vacuolar degeneration (irregular arrows) and numerous apoptotic cells (short arrows). H&E stain X100, X200, X100, X 200, X200, and X200 respectively
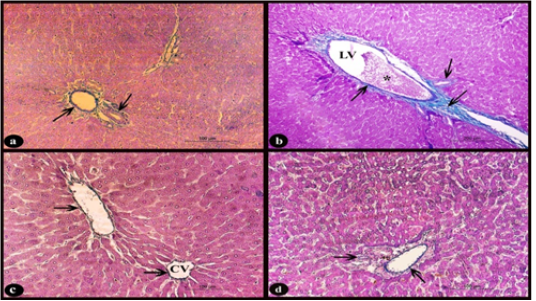
Sections stained with Crossmon’s trichrome stain showing; a) Rat liver of control group, normal distribution of collagen fibers of green color in the interlobular connective tissue septa and perivascular tissue of the portal area (arrows), X 200. b) Rat liver of D group, obvious slight increase of collagen fibers (arrows) around dilated lymphatic vessel (LV) with congestion (*), X 100. c-d) Rat liver of D+M and D+P groups, normal distribution of collagen fibers (arrows) nearly to that of control group around the central vein (CV) and in the perivascular tissue compared to D group, X200

Sections in rat liver stained with PAS stain (left column) and Bromophenol blue stain (right column) X200 in the area of central vein (CV) showing; a-b) control group, normal hepatocytes with strong cytoplasmic positive reactions, c-d) D group, degenerated hepatocytes with weak positive reactions, e-f) D+M and g-h) D+P groups, slight depletion of muccopolysaccharides and protein indicated by moderate cytoplasmic positive colors compared with (D) group.
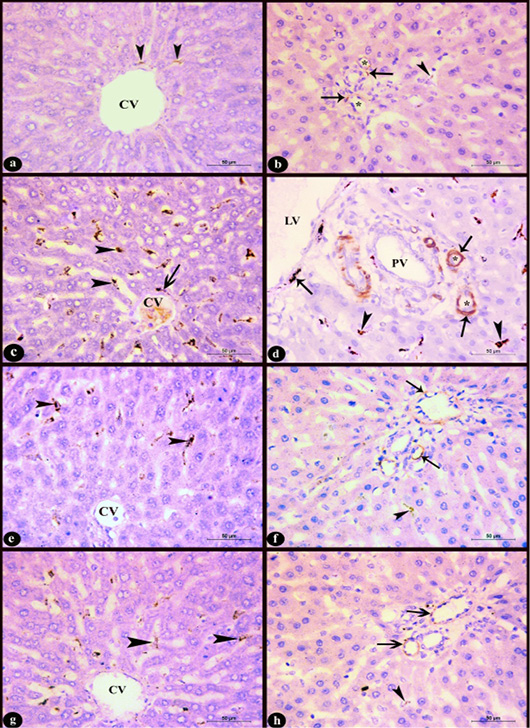
Sections in rat liver stained immunohistochemistry with Anti-Desmin antibody clone (D33, M0760) X400 in the area near to the central vein (CV) (left column) and the region of the portal area (right column) showing; a-b) Control group; few desmin positive cells, c-d) Group D; increased number of desmin positive cells with high intensity, e-f) D+M and g-h) D+P groups; decreased number of desmin positive cells compared to group D. Notice, positive sinusoidal cells near to the central vein (arrow heads), desmin positive cells in the perivascular tissue (arrows), lymphatic vessel (LV), portal vein (PV), hepatic arteries (*).
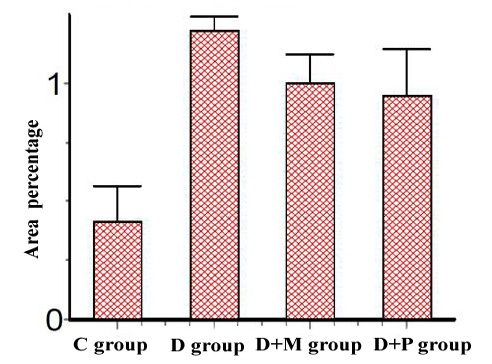
Area percentage of Desmin Immunoexpression in various studied rat groups, (The p value is < 0.05)


