Advances in Animal and Veterinary Sciences
Research Article

Effects of Different Fibre Sources in Pig Diets on Growth Performance, Gas Emissions and Slurry characteristics
Tran Thi Bich Ngoc1*, Tran Thi Thanh Thao1, Pham Van Dung2
1National Institute of Animal Science, Hanoi, Vietnam; 2Alliance of Bioversity International and International Center for Tropical Agriculture.
Abstract | The effects of different fibre sources in pig diets on growth performance, ammonia (NH3), hydrogen sulphide (H2S), greenhouse gas (GHG) emissions and slurry characteristics was studied on 20 crossbred pigs [Duroc x F1 (Landrace x Yorkshire)]. The experimental diets included one low-fibre (LF) diet without maize distiller’s dried grains with solubles (DDGS), brewer’s grain (BG) and coconut cake (CC) and 3 high-fibre (HF) diets with maize DDGS or BG or CC. The experiment was conducted according to a completely randomized design with 5 replications and lasted 62 days. In the growing period and the overall, pigs fed diets LF and HF-DDGS had higher average daily gain (ADG) compared to pigs fed diets HF-BG and HF-CC (P < 0.05), wheareas the ADG was lower for pigs fed diets HF-BG and HF-CC than for diet LF (P < 0.05) in the fattening period. There was lower FCR for diets LF and HF-DDGS than for diets HF-BG and HF-CC (P < 0.05) in both periods and overall. In the growing and fattening pigs, diets didn’t affect N and P intake, slurry DM content (%) and amount of slurry (kg/head/day), slurry P content (%DM) (P > 0.05), while N and P excretions (g/head/day) were greater for diet HF-CC than for diet LF (P < 0.05). The CO2 emission was greater for diets HF-BG and HF-CC than for diets LF and HF-DDGS (P < 0.0001) in the growing period, but not for fattening period (P > 0.05). In both periods, CH4 emission was lower in diet LF than in diet HF-BG and HF-CC (P < 0.05), while NH3 emission was higher for pigs fed diet LF than pigs fed HF-BG and HF-CC (P < 0.05). The H2S emission was not affected by diets in both periods. In conclusion, different fibre sources in pig diets may be a practical method to alter growth performance, slurry characteristics and NH3, GHG emissions.
Keywords | Fibre source, Emission, Growth performance, Pig diet, Slurry
Received | October 12, 2020; Accepted | October 20, 2020; Published | December 10, 2020
*Correspondence | Tran Thi Bich Ngoc, National Institute of Animal Science, Hanoi, Vietnam; Email: bichngocniah75@hotmail.com
Citation | Ngoc TTB, Thao TTT, Dung PV (2021). Effects of different fibre sources in pig diets on growth performance, gas emissions and slurry characteristics. Adv. Anim. Vet. Sci. 9(1): 63-72.
DOI | http://dx.doi.org/10.17582/journal.aavs/2021/9.1.63.72
ISSN (Online) | 2307-8316; ISSN (Print) | 2309-3331
Copyright © 2021 Ngoc et al. This is an open access article distributed under the Creative Commons Attribution License, which permits unrestricted use, distribution, and reproduction in any medium, provided the original work is properly cited.
INTRODUCTION
In most countries, the intensive pig production has a significant impact on the environment. Pig manure is the mainly source of greenhouse gases (GHG) like methane (CH4) and carbon dioxide (CO2), and other noxious gases such as ammonia (NH3) and hydrogen sulphide (H2S). Slurry composition and gas emissions can be affected by diet compositions, such as sources and levels of fibre (Canh et al., 1998b; Jarret et al., 2012; Kerr et al., 2020; Hansen et al., 2007; Triolo et al., 2011; Beccaccia et al., 2015a), levels of protein (Canh et al., 1998a; Portejoie et al., 2004; Hernández et al., 2011) and sources of protein (Beccaccia et al., 2015b). Feed accounts approximately 70% of the cost of pork production (Iowa State University Extension, 2018), the use of by-products from food production or biofuel processing with cheap price would be recommended as a relevant economic alternative. In this study, coconut cake (CC), distiller’s dried grains with solubles (DDGS) and brewer’s grain (BG) are selected in terms of different soluble and insoluble non-starch polysaccharides (NSP) as fibrous dietary ingredient sources (Ngoc et al., 2012; Pedersen et al., 2014). These differences between fibre sources will be expected to affect the slurry composition and GHG emissions. In a previous study, Jarret et al. (2011) evaluated the effect of the incorporation of different by-products (wheat DDGS, sugar beet, and fatty rapeseed meal) on slurry composition and methane emission. They showed that the manure issued from a diet with 20% wheat DDGS produced less CH4 than expected, compared to the other diets and suggested that this could be related to the manufacturing process of wheat DDGS which requires heating processes that may be causing reactions between protein and other molecules, such as lignin, resulting in products difficult to degrade by the bacteria involved in the anaerobic digestion, in the same way as it affects the nutritional value. Therefore, this study was investigated to determine the effects of the fibrous diets containing different fibre sources on NH3, H2S, GHG emissions and pig slurry characteristics.
MATERIALS AND METHODS
The study was conducted at Thuy Phuong Pig Research Center, National Institute of Animal Science, Vietnam, from August to November 2018.
Experimental design, animals, diets and housing
The experimental diets (Table 1) were based on maize, soybean meal, fish meal, rice bran, maize DDGS, BG and CC. The low-fibre (LF) diets, containing around 172 g NDF/kg dry matter (DM), was formulated without maize DDGS, BG and CC as feed ingredients. The HF diets (HF-DDGS, HF-BG and HF-CC) were formulated around 217 - 245 g NDF/kg DM. All diets were formulated to meet NRC (1998) nutrient requirements [crude protein (CP), metabolizable energy (ME), calcium (Ca), phosphorus (P) and essential amino acids] (Table 2). The diets were offered in mash form.
A total of 20 crossbred pigs [Duroc x F1 (Landrace x Yorkshire)] from 4 litters with an equal number of males and females, with the initial body weight (BW) of 20.7±0.44 kg (around 68 days old), distributed equally into 4 treatments [LF (control), HF-DDGS, HF-BG and HF-CC] according to a completely randomized design. Each treatment composed of 5 pens, with one pig per pen as a replicate. The length of the experiment was 62 days. Before the experiment started, all pigs were vaccinated. The pigs were kept individually in concrete floored pens (1.8 m x 0.8 m) with a slatted floor at the rear in an open-sided house. There was a separate manure pit (110 cm length x 50 cm width x 40 cm depth) per pen under the slatted floor.
Pigs were fed 2 times per day at 08h30 and 15h30 with 4.0-5.0% of the BW. The amount of feed intake was adjusted daily according to the expected BW gain. The pigs accessed feed and water by mixing with the ratio 1:4 (w/w) and they were not given any additional water in order to prevent the effects of slurry volume, dilution and emitting area on the emission of environmental pollution causing compounds and manure characteristics. The BW of individual pig was determined at the beginning and at the end of the experimental period before the morning feeding. Feed intake was recorded on a pen basis throughout the experiment period to calculate average daily feed intake (ADFI) and feed conversion ratio (FCR).
Measurements and Data Collection
Measuring and calculating hydrogen sulfide and ammonia emissions: In each experimental period, after an adaptation period of 5 days, pens and slurry pits were cleaned. Subsequently feces and urine were accumulated together in the slurry pit for 26 days. At the 31st day, air samples for NH3 and H2S emission measurements were collected between 9h00 and 14h00.
Air samples for determining NH3 emission were collected directly from air above the slurry pits according to the method of Le et al. (2009) and with the ventilation rate of 0.5l/minute. Ammonia emission from the slurry pit was calculated with equation 1.
MNH3 = (CNH3 x V x 10.000) / (T x 60 x S) [1]
In which: MNH3=ammonia emission (mg/s/m2), CNH3=ammonia concentration (mg/mL HNO3), V=volume of HNO3 (mL), 10.000=cm/m2, T=sampling time (10 minutes), 60=s/min, S: emitting surface, 312 cm2.
The principle of measuring and calculating H2S emission was similar to NH3. Hydrogen sulfide emission was calculated with equation 1, in which the volume of HNO3 was replaced by that of 0.1M CdSO4. Hydrogen sulfide was trapped by Cadimi Sulfate 0.1M in the impinges.
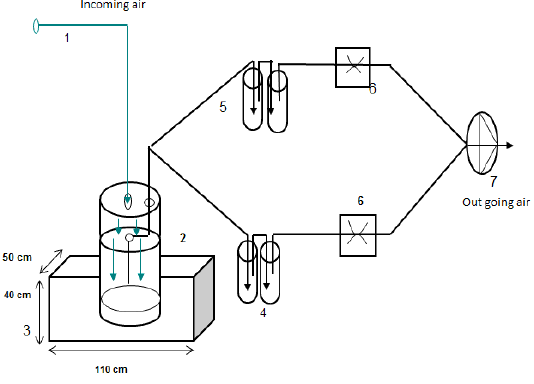
Figure 1: Schematic view of air sampling for NH3 and H2S emission measurement (1= incoming air, 2= chamber, 3=slurry pit, 4=impinger for ammonia measurement, 5= impinger for hydrogen sulfide measurement, 6=critical capillary, 7=vacuum pump)
Table 1: Feed ingredients of experimental diets (as air-dry basis)
| Ingredients (%) | LF | HF-DDGS | HF-BG | HF-CC |
| Maize | 63 | 53.2 | 52.04 | 52.2 |
| Soybean meal | 19.7 | 15 | 17.0 | 18.4 |
| Fish meal | 4.0 | 0 | 0 | 0 |
| DDGS maize | 0 | 25 | 0 | 0 |
| Brewer’s grain | 0 | 0 | 25 | 0 |
| Coconut cake | 0 | 0 | 0 | 25 |
| Rice bran | 10.0 | 0.00 | 0.00 | 0.00 |
| Soybean oil | 1.2 | 4 | 3.5 | 1.8 |
| Dicalcium phosphate | 0.5 | 1.3 | 0.8 | 0.8 |
| Limestone meal | 0.1 | 0.5 | 0.7 | 0.8 |
|
Premix mineral-vitamina |
0.25 | 0.25 | 0.25 | 0.25 |
| L-Lysine | 0.05 | 0.25 | 0.21 | 0.23 |
| DL-Methionine | 0 | 0 | 0 | 0.02 |
| Salt (NaCL) | 0.5 | 0.5 | 0.5 | 0.5 |
a Content per kg of air dry diet. Vitamin A, 2000 IU; vitamin D3, 400 IU; vitamin E, 12.5 mg; vitamin K, 3 mg; vitamin B1, 2.5 mg; vitamin B12, 100 IU; Ca, 0.275 g; Cu, 27.5 mg; Fe, 25 mg; Zn, 37 mg; Co, 0.5 mg; iodine, 0.38 mg; Se, 0.11 mg.
LF, low fibre diet; HF-DDGS, high fibre diet containing maize DDGS; HF-BG containing brewer’s grain; HF-CC, containing coconut cake.
Table 2: Chemical compositions and nutritive values of experimental diets (as air-dry basis)
| Criteria | LF | HF-DDGS | HF-BG | HF-CC |
| Dry matter (%) | 89.92 | 90.09 | 90.09 | 90.04 |
| Crude protein (%) | 18.03 | 18.02 | 18.03 | 18.02 |
| Crude fibre (%) | 4.90 | 5.06 | 6.81 | 6.21 |
| NDF (%) | 17.21 | 21.73 | 24.47 | 23.67 |
| Calcium (%) | 0.62 | 0.61 | 0.60 | 0.59 |
| Available phosphorus (%) | 0.24 | 0.26 | 0.23 | 0.23 |
| Total lysine (%) | 0.97 | 0.93 | 0.95 | 0.96 |
| Total Methionine+Cysteine (%) | 0.58 | 0.58 | 0.57 | 0.54 |
| Total threonine (%) | 0.69 | 0.64 | 0.63 | 0.62 |
| Total tryptophan (%) | 0.23 | 0.19 | 0.22 | 0.23 |
| Total NSP (%) | 11.52 | 14.34 | 16.41 | 17.80 |
| Soluble NSP (%) | 2.73 | 2.98 | 2.55 | 3.33 |
| Klason Lignin (%) | 2.03 | 1.43 | 3.64 | 2.58 |
| Total dietary fibre (%) | 13.55 | 15.77 | 20.06 | 20.38 |
| ME (Kcal/kg) | 3117.85 | 3116.94 | 3121.89 | 3114.95 |
LF, low fibre diet; HF-DDGS, high fibre diet containing maize DDGS; HF-BG containing brewer’s grain; HF-CC, containing coconut cake.
Collection and measurement of slurry characteristics: On 28th day of each period, slurry in each slurry pit was mixed thoroughly before a sample of about 1 kg was collected. Slurry samples was kept at -200C until analysis. Slurry samples was analysed for dry matter (DM), total nitrogen (N), P and pH.
Measurement and calculation of greenhouse gas emission: The method of static chamber has been applied extensively to measure rates of trace gas emission sources (Hutchinson & Mosier, 1981; Hutchinson & Livingston, 1993; Kusa et al., 2008). It allows to detect gases emitted from a surface of a volatile solid within a known volume during a given period of time. A static chamber system was connected to a Gasmet DX-4040 Fourier Transform Infrared Multicomponent Trace Gas Analyser (FTIR; Gasmet Technologies Oy, Helsinki, Finland) to detect GHG concentrations from pig slurry. The system includes a cylindrical frame, four round cylinder bases and peripheral accessories as such sampling ports, transparent flexible plastic tubes. The gas analyser measures main GHG at low concentrations in parts per million unit per seconds (ppm/s) including CO2, CH4 and N2O. The response time of the analyser is 20 seconds for one reading and the flow speed of sample pump is 1.5 liters per minute. The gas analyzer must be calibrated with pure nitrogen (2 liters per minute speed) prior to each measurement.
Pig slurry samples were collected using white plastic plates with radius (r = 9.25 cm) and weighed the initial mass (450 g) using an electronic scale (Model-HY K17, 5kg) before the gas flux measurement. The GHG emissions rates were determined from linear regressions, using the goodness of fit and the significant level for model selection. Emission fluxes were computed from the slope of the linear regression between gas concentrations versus time within the container headspace (Whalen and Reeburgh, 2001). As such, fluxes were calculated from the equation is described as follow:
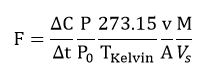
Where: F is the flux rate (mass unit/m2/h1); P is the measured ambient pressure (mbar); P0 is the standard pressure (1013.25 mbar); v is the total system volume (L), (); V is the volume occupied by 1 mol of the gas at standard temperature and pressure (STP) (0.024 m3, or 22.4 L); A is surface area of the chamber over the emission source (0.027 m2); T is the ambient temperature in degrees celsius (0C); TKelvin is the temperature T in Kelvin (K) = (273.15 + Tc); is the change in concentration in time interval t or the slope of the gas concentration curve (ppm/s); M is the molecular weight of the gas (g/mol).
Chemical Analysis
Dry matter (967.03), total N (984.13), ash (942.05), P and Ca were analysed according to the standard AOAC methods (Association of Official Analytical Chemist, 1990). The NDF content was analysed by the method of Van Soest et al. (1991). Amino acids were analysed by HPLC using an ion exchange column (Amino Quant, 1990). Slurry pH was determined by pH meter HI 8424 HANNA (Made in Mauritius).
Total, soluble and insoluble NSP and their constituent sugars were determined as alditol acetates by gas chromatography (Model: Agilent 6890N, Agilent Technologies Inc., Santa Clara, CA, USA) for neutral sugars, and by a colorimetric method for uronic acids using a modification of the Uppsala method (Theander et al., 1995), as described by Bach Knudsen (1997). Klason lignin was determined as the 12M H2SO4 insoluble residue. Total DF is the sum of Klason lignin and total NSP (T-NSP). Content of different fibre fractions were calculated as follows:
Cellulose = NSP glucose (12 mol/l H2SO4) - NSP glucose (2 mol/l H2SO4)
Total non-cellulosic polysaccharides (T-NCP) = rhamnose + fucose + arabinose + xylose + mannose + galactose + glucose + uronic acids
T-NSP = T-NCP + cellulose
Soluble NCP (S-NCP) = T-NCP - I-NCP
Data Analysis
All data were analysed using the GLM procedures of Minitab Programme Version 16.2 with the kind of 4 diet as the main factor. When P values of the F test <0.05; Tukey tests were used for pairwise comparision.
RESULTS
In the growing (20-40kg), fattening (40-70kg) periods and overall, the ADFI were similar (P > 0.05) among diets (Table 3). The final BW at the growing period and the fattening period was statisticaly significant different among diets (P < 0.05), with the higher value for the diets LF and HF-DDGS compared to the diets HF-BG and HF-CC.
The diet affected the ADG and FCR in both growing and fattening periods and the overal (P < 0.05). In the growing period and overall, pigs fed diets LF and HF-DDGS had higher ADG compared to pigs fed diets HF-BG and HF-CC (P < 0.05). However in the fattening period, the ADG was lower for pigs fed diets HF-BG and HF-CC than for diet LF (P <0.05), while diet HF-DDGS had similar ADG to diets LF, HF-BG and HF-CC (P > 0.05). There was lower FCR for diets LF and HF-DDGS than for diets HF-BG and HF-CC (P < 0.05) in both growing and fattening periods and the overall.
The nutrient intakes are shown in Table 4. In both growing and fattening periods, there were no significant differences in N and P intake (P > 0.05), while T-NSP, S-NSP and Klason lignin intake were affected by diets (P < 0.0001). The T-NSP intake was the highest value for diet HF-CC, followed in descreasing order by diets HF-BG, HF-DDGS and LF, wheares the Klason lignin was the highest for diet HF-BG, following by diets HF-CC and LF, and the lowest value for diet HF-DDGS.
The slurry chemical chararteristics and N, P excretion in the growing and fattening periods are presented in Table 5. In the growing period, slurry DM content (%) and amount (kg/head/day), slurry P content (%DM) did not differ among diets (P > 0.05) (Table 5). The highest pH slurry
Table 3: Average daily feed intake (ADFI), average daily gain (ADG) and feed conversion ratio (FCR) for experimental diets
| LF | HF-DDGS | HF-BG | HF-CC | SEM | P | |
| Growing period (20-40 kg) | ||||||
| Initial BW (kg) | 20.78 | 20.74 | 20.64 | 20.68 | 0.441 | 0.996 |
| Final BW (kg) |
41.20a |
40.90a |
38.50ab |
38.10b |
0.682 | 0.009 |
| ADG (g) |
659a |
650a |
576b |
562b |
20.27 | 0.006 |
| ADFI (kg) | 1.48 | 1.50 | 1.49 | 1.45 | 0.045 | 0.815 |
| FCR (kg feed/kg gain) |
2.26a |
2.31a |
2.59b |
2.57b |
0.065 | 0.003 |
| Fattening period (40-70 kg) | ||||||
| Initial BW (kg) |
41.20a |
40.90a |
38.50ab |
38.10b |
0.682 | 0.009 |
| Final BW (kg) |
70.90a |
70.40a |
65.80b |
64.90b |
1.119 | 0.002 |
| ADG (g) |
958a |
952ab |
881b |
864b |
22.92 | 0.020 |
| ADFI (kg) | 2.60 | 2.63 | 2.60 | 2.55 | 0.058 | 0.797 |
| FCR (kg feed/kg gain) |
2.72a |
2.77a |
2.97b |
2.95b |
0.067 | 0.037 |
|
Overall (20-70 kg) |
||||||
| ADG (g) |
808a |
801a |
728b |
713b |
16.33 | 0.001 |
| ADFI (kg) | 2.04 | 2.07 | 2.05 | 2.00 | 0.045 | 0.739 |
| FCR (kg feed/kg gain) |
2.53a |
2.58a |
2.82b |
2.80b |
0.045 |
0.001 |
LF, low fibre diet; HF-DDGS, high fibre diet containing maize DDGS; HF-BG containing brewer’s grain; HF-CC, containing coconut cake; BW, body weight.
Table 4: Average daily nutrient intake (g) for experimental diets
| LF | HF-DDGS | HF-BG | HF-CC | SEM | P | |
| Growing period (20-40 kg) | ||||||
| Nitrogen | 42.81 | 43.36 | 43.10 | 41.69 | 1.304 | 0.812 |
| Phosphorus | 7.57 | 7.67 | 7.77 | 7.52 | 0.233 | 0.876 |
| Total NSP |
170.96a |
215.67b |
245.17c |
257.39c |
6.633 | <0.0001 |
| Soluble NSP |
41.11bc |
45.12ab |
38.1c |
48.15a |
1.281 | <0.0001 |
| Klason Lignin |
30.13a |
21.51b |
54.38c |
37.31d |
1.212 | <0.0001 |
| Fattening period (40-70 kg) | ||||||
| Nitrogen | 75.00 | 75.94 | 75.12 | 73.58 | 1.680 | 0.796 |
| Phosphorus | 13.26 | 13.43 | 13.54 | 13.27 | 0.299 | 0.891 |
| Total NSP |
299.52a |
377.72b |
427.32c |
454.26c |
8.227 | <0.0001 |
| Soluble NSP |
72.02a |
79.02b |
66.4a |
84.98b |
1.644 | <0.0001 |
| Klason Lignin |
52.78a |
37.67b |
94.79c |
65.84d |
1.465 |
<0.0001 |
Table 5: Slurry chemical characteristics and nitrogen (N) and phosphorus (P) excretion by experimental diets
| LF | HF-DDGS | HF-BG | HF-CC | SEM | P | |
| Growing period (20-40 kg) | ||||||
| pH slurry |
7.46a |
7.34ab |
7.26b |
7.20b |
0.047 | 0.007 |
| Slurry DM (%) | 17.29 | 15.46 | 17.07 | 17.79 | 0.592 | 0.067 |
| Slurry amount (kg DM/head/day) | 0.19 | 0.18 | 0.19 | 0.20 | 0.009 | 0.453 |
| Slurry N (%DM) |
2.92a |
3.23ab |
3.68ab |
4.16b |
0.267 | 0.025 |
|
Slurry P (%DM) |
1.39 | 1.57 | 1.72 | 1.80 | 0.115 | 0.096 |
| Excreta N (g/head/day) |
5.42a |
5.83a |
6.81ab |
8.28b |
0.465 | 0.002 |
| Excreta P (g/head/day) |
2.55a |
2.82ab |
3.23ab |
3.59b |
0.200 | 0.011 |
| Fattening period (40-70 kg) | ||||||
| pH slurry |
6.66a |
6.62a |
6.41ab |
6.30b |
0.066 | 0.004 |
| Slurry DM (%) | 17.87 | 17.57 | 17.97 | 19.07 | 0.608 | 0.352 |
| Slurry amount (kg DM/head/day) | 0.27 | 0.26 | 0.28 | 0.30 | 0.017 | 0.394 |
| Slurry N (%DM) | 3.42 | 3.74 | 4.14 | 4.12 | 0.240 | 0.145 |
| Slurry P (%DM) |
1.32a |
1.51ab |
1.63ab |
1.80b |
0.093 | 0.018 |
| Excreta N (g/head/day) |
9.02a |
9.74ab |
11.47bc |
12.17c |
0.576 | 0.004 |
| Excreta P (g/head/day) |
3.48a |
3.94a |
4.55ab |
5.38b |
0.329 |
0.005 |
Slurry: faeces+urine
was observed for diet LF (7.46), followed in descending order by diet HF-DDGS (7.34), diet HF-BG (7.26) and diet HF-CC (7.20) (P < 0.05). Slurry N content (%DM) and N and P excretions (g/head/day) were similar among diets LF, HF-DDGS and HF-BG (P > 0.05), while they were greater in diet HF-CC than in diet LF (P < 0.05).
Similar to the growing period, in the fattening period there were no differences in slurry DM content (%) and amount (kg/head/day), slurry N content (%DM) among diets (P > 0.05) (Table 5). The pH slurry was affected by diets (P < 0.05), with the higher value for diets LF and HF-DDGS, followed by diet HF-BG and the lowest value for HF-CC. However, pigs fed diet LF showed lowest slurry P content (%DM) and N and P excretions (g/head/day), followed in decreasing order by diet HF-DDGS, diet HF-BG and HF-CC (P < 0.05).
In the growing period, the concentration of CO2 emission was greater for diets HF-BG and HF-CC than for diets LF and HF-DDGS (P < 0.0001) (Table 6). However, in the fattening pigs, the CO2 emission in diets HF-DDGS and HF-BG didn’t differ to diets LF and HF-CC (P > 0.05), but it was different significance between diets LF and HF-CC (P < 0.005). In both growing and fattening periods, the CH4 emission in diet HF-BG was similar to diets HF-DDGS and HF-CC (P > 0.05), whereas it was lower in diet LF than in diets HF-BG and HF-CC (P < 0.05). In the growing period, the NH3 emission was higher for pigs fed diet LF than pigs fed HF-BG and HF-CC (P < 0.05), while it was similar among diets HF-DDGS, HF-BG and HF-CC (P > 0.05). In the fattening period, the NH3 emission was lower for pigs fed diets HF-BG and HF-CC than for pigs fed diets LF and HF-DDGS (P < 0.05). The concentration of N2O and H2S emissions did not differ among diets (P > 0.05) in both growing and fattening periods.
DISCUSSION
In the current study, pigs fed diets LF and HF containing either DDGS or BG or CC had similar ADFI in both growing and fattening periods and the overall. These results are similar to earlier studies (Len et al., 2009; Ngoc and Dang, 2016) that didn’t observe differences in DM intake of pigs given LF and HF diets on the basis of rice bran, sweet potato vines, cassava residue (CR), tofu residue and CC. In contrast, Ngoc et al. (2013) showed that fibre source had an impact on mean retention time, with the shorter mean retention time of CR as compared with BG, resulting in lower DM intake for HF diet containing CR than HF diet containing BG.
In the growing period, pigs fed the LF and HF-DDGS diets improved ADG compared to pigs fed the HF-BG and HF-CC diet. This could be due to an association of lower T-NSP and Klason lignin intake (Table 3), thus resulting in better dietary nutrient digestibility in the LF and HF-DDGS diets. In previous studies (Högberg and Lindberg, 2004; 2006; Serena et al., 2008; Ngoc et al., 2013), source and level of dietary fibre had a pronounced effect on the site of organic mater, CP and GE digestion. The digestibility of OM, CP and GE at ileum and total tract was reduced with an increase in dietary fibre level. Besides, the total tract digestibility of OM, CP and GE was improved with an increase in the solubility of the dietary fibre fraction in the diets containing different fibre sources. In the fattening period, diet LF had higher ADG compared to diets HF-BG and HF-CC, but it was not different among diets HF-DDGS, HF-BG and HF-CC. These results indicated that apparently the animal response to diets containing different fibrous feed sources may relate to the age of animals, the older pigs can utilize fibrous diet better than younger pigs (Choct et al., 2010).
Diet composition had effects on nutrient digestibility and metabolism, and on the fermentation rates in the hindgut, as resulted in affecting slurry characteristics and thus gas emissions (Møller et al., 2004a,b; Dinuccio et al., 2008). Pigs showed lower N excretion for the LF diet than for the HF-CC diet in the growing and fattening periods and this result may be due to T-NSP intake was lower in the LF diet than in the HF-CC diet (Table 4). Inclusion of NSP into pig diets also shifts N excretion from urine to feces (Canh et al., 1997; Galassi et al., 2010; Heimendahl et al., 2010). Because of fecal N is less easily degraded to NH3, the inclusion of sugar beet pulp into grow-finishing diets results in a linear relationship between the NSP intake and the NH3 emission, decreasing by 5.4% for each 100g inc-
Table 6: Gas emissions from slurry by experimental diets
| LF | HF-DDGS | HF-BG | HF-CC | SEM | P | |
| Growing period (20-40 kg) | ||||||
|
CO2 (g/h/m2) |
2.62a |
3.49a |
5.87b |
6.22b |
0.277 | <0.0001 |
|
CH4 (mg/h/m2) |
375.56a |
490.72ab |
575.30bc |
692.55c |
34.801 | <0.0001 |
|
N2O (µg/h/m2) |
2.10 | 1.92 | 1.64 | 1.53 | 0.362 | 0.247 |
|
NH3 (mg/h/m2) |
0.479a |
0.439ab |
0.369b |
0.356b |
0.0215 | 0.002 |
|
H2S (mg/h/m2) |
0.054 | 0.064 | 0.071 | 0.063 | 0.0102 | 0.715 |
|
Fattening period (40-70 kg) |
||||||
|
CO2 (g/h/m2) |
2.56a |
3.023ab |
3.157ab |
3.797b |
0.225 | 0.003 |
|
CH4 (mg/h/m2) |
364.40a |
413.19ab |
476.45bc |
498.45c |
19.58 | <0.0001 |
|
N2O (µg/h/m2) |
2.64 | 2.13 | 1.99 | 1.72 | 0.561 | 0.710 |
|
NH3 (mg/h/m2) |
0.551a |
0.541a |
0.444b |
0.420b |
0.0170 | <0.0001 |
|
H2S (mg/h/m2) |
0.079 | 0.085 | 0.095 | 0.087 | 0.0075 |
0.550 |
-rease in the intake of dietary NSP (Canh et al., 1998b). Various nutritional strategies, as the inclusion of fibre sources in feeds, have been proposed in order to mitigate NH3 emission derived from manure in pig farms. Several works indicate that these effects are depending on the type of fibre used. Dietary supply of fermentable fibre also reduced faecal and slurry pH through an increase of volatile fatty acids (VFA) formation in the large intestine, thereby decreasing additionally NH3 emission (Canh et al., 1998a,b). These results were confirmed by the current study with higher slurry pH and NH3 emission for diets LF and HF-DDGS than for diet HF-BG and HF-CC. Increasing dietary fibre in pig diets is generally to decrease manure pH and NH4-N concentrations (Kerr et al., 2006, 2018; Ngoc and Dang, 2016; Trabue and Kerr, 2014; van Weelden et al., 2016), but this is not always a consistent observation (van Weelden et al., 2016). The study by Kerr et al. (2020) was no exception to this lack of consistency and the authors reported that manure from pigs fed the HF-DDGS diet had higher manure NH4-N, but no change in manure pH, compared to pigs fed the LF containing corn-soybean meal diet; while pigs fed the HF containing soybean hull diet produced a manure with similar NH4-N, but lower pH, compared to manure from pigs fed the corn-soybean meal diet. Besides, it is suggested that the use of more lignified fibre sources (e.g. oat hulls) had no influence on N partitioning (Zervas and Zijlstra, 2002; Bindelle et al., 2009); otherwise, it decreases nutrient digestibility and might then modify excreta composition and NH3 emission. Beccaccia et al. (2015a) indicated that CP digestibility was decreased when NDF in the diet was replaced with more fermentable or lignified sources of fibre led to an increase of faecal CP excretion on DM and N concentration in urine DM and a decrease of g NH3/kg slurry. In all these works, inclusion of the various types of fibre studied was parallel to an increase of dietary fibre concentration, and therefore the effects of source and level of the ingredients used were confounded.
Most of CH4 emissions in pigs are originated from the digestive tract and during manure storage, as a result of the degradation of organic compounds by methanogenic archaea. They will depend both on the amount and composition of organic matter excreted. Highly lignified cell wall components of feeds remain undigested and constitute the main energy substrate for CH4 production, and can also increase the excretion of other nutrients in faeces. However, cellulose and lignin have the lowest CH4 potential emissions, whereas undigested lipids and protein have the highest (Angelidaki and Sanders, 2004). In practical conditions, the inclusion of different fibre sources, such as DDGS, sugar beet pulp or rapeseed meal led to variable effects on the potential for CH4 production from faeces and the total CH4 produced per pig (Jarret et al., 2011, 2012). Thus, altering source of dietary fibre can potentially serve to manipulate CH4 emissions from slurry. The current data showed that CH4 production from slurry was higher 1.15-1.53 and 1.21-1.84 times in diets HF-BG and HF-CC compared to diets HF-DDGS and LF in both growing and fattening pigs, respectively. This result could be due to diets HF-BG and HF-CC had higher intake of total DF and other fibre components (NDF, T-NSP and Klason lignin) than diets HF-DDGS and LF, leading to more methanogens diversity (Cao et al., 2012) or abundance (Liu et al., 2012), and therefore increasing CH4 emission (Seradj et al., 2018). In the experiment done by Ngoc and Dang (2016), CH4 emitted from slurry higher for HF diet than for LF diet by from 13% to 18%. Pigs fed diet HF-CC increased CH4 emission from slurry by from 10% to 12% compared with pigs fed diet tofu residue.
The current data showed that CO2 production from slurry was higher 1.68-2.24 and 1.78-2.37 times in diets HF-BG and HF-CC compared to diets HF-DDGS and LF in the growing pigs, respectively. However, the emission of CO2 from feaces was observed greater 1.48 times for diet HF-CC compared to diet LF in fattening pigs. According to Ngoc and Dang (2016), fibre source and fibre level had no impact on the emission of CO2 from slurry in both growing and fattening pigs, except for the impact of fibre level on CO2 emission in the growing pigs. Philippe et al. (2015) reported the emissions of CO2 did not shown any significant difference regarding the diets LF and HF, as well for gestating sows as for fattening pigs. However, Clark et al. (2005) indicated that pigs fed diet with 20% sugar beet pulp reduced CO2 emission from slurry samples by 17% compared to 0% sugar beet pulp.
CONCLUSIONS
Different fibre sources in pig diets is a potential method to alter growth performance, slurry characteristics and NH3, GHG emissions. Diets LF and HF-DDGS had higher ADG and NH3 emission, and lower N, P excretion and CO2, CH4 emissions than diets HF-BG and HF-CC.
ACKNOWLEDGEMENTS
This study was financed by SIDA/SAREC (Swedish International Development Cooperation Agency - Department for Research Cooperation), through the regional MEKARN II program and the Swedish University of Agricultural Sciences.
CONFLICT OF INTEREST
The authors declare that they have no conflict of interest.
AUTHORS CONTRIBUTION
TTBN, the first author, designed the study, coordinated the work, analysed the data and wrote the manuscript. TTTT and PVD collected and analysed the data, and revised the manuscript. All authors read and approved the final manuscript.
REFERENCES


