Advances in Animal and Veterinary Sciences
Research Article
Adv. Anim. Vet. Sci. 9(1): 55-62
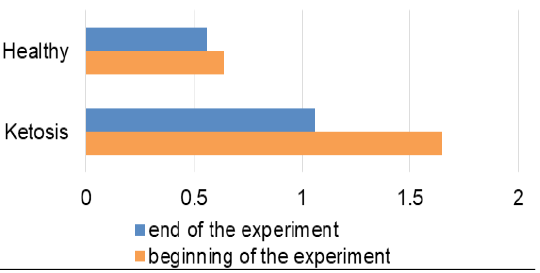
Figure 1
Concentration of β-hydroxybutyrate in the blood (mmol/L)
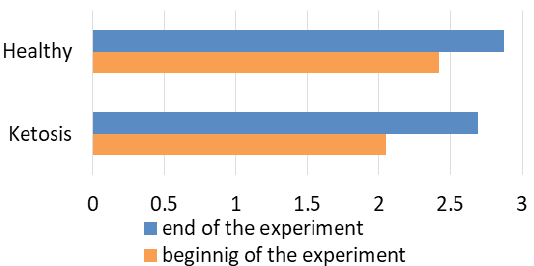
Figure 2
Concentration of glucose in the blood (mmol/L)
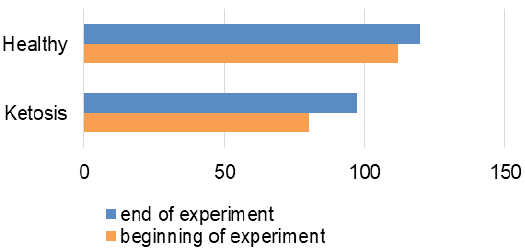
Figure 3
Concentration of insulin in plasma (pmol/L)
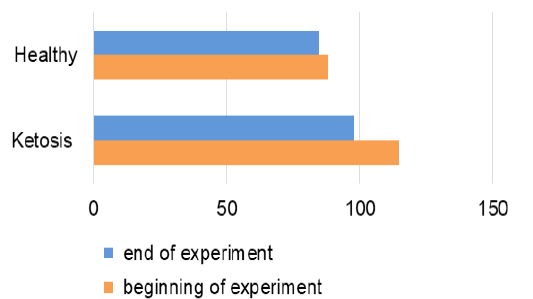
Figure 4
Concentration of cortisol in plasma (nmol/L)
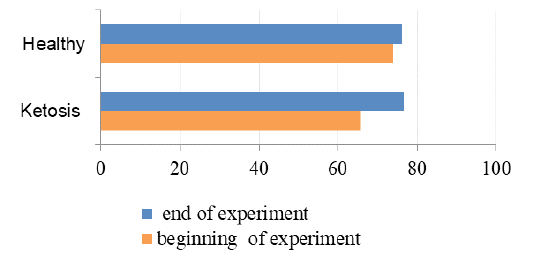
Figure 5
The contents of total protein in serum (g/L).
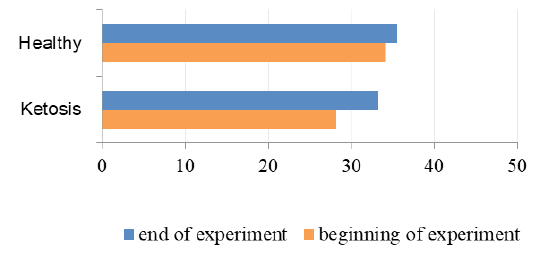
Figure 6
The contents of albumin in serum (g/L).
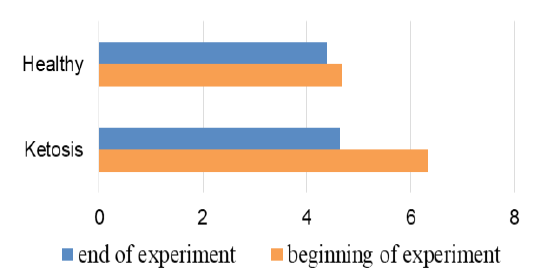
Figure 7
The contents of urea nitrogen in serum (mmol/L).
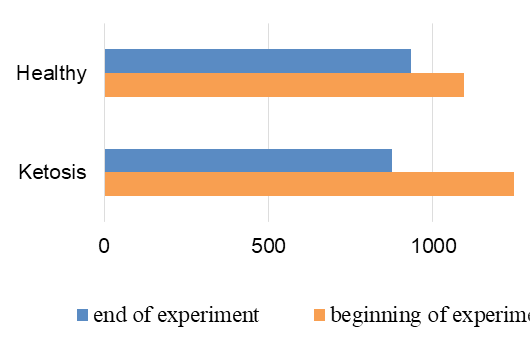
Figure 8
AST activity in serum; nkat/L
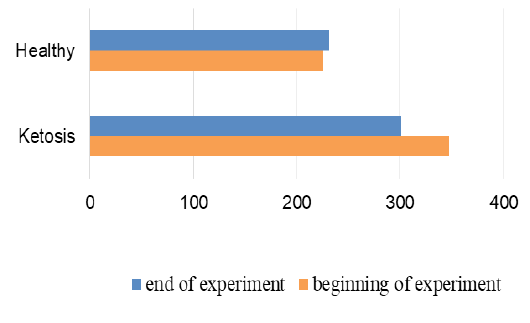
Figure 9
ALT activity in serum; nkat/L


