Advances in Animal and Veterinary Sciences
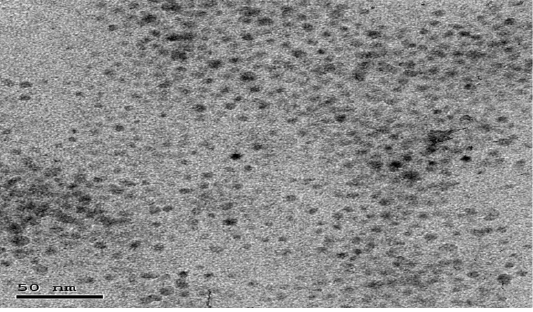
Showing TEM image of Nanoparticles showed distinct spherical particles in size range between 5 and 100 nm.
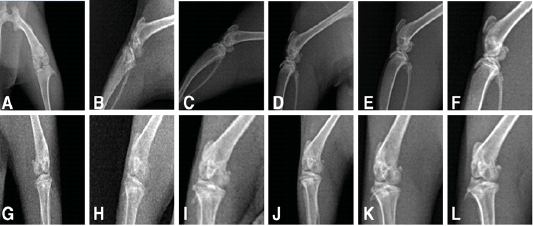
X-ray of the knee joints treated and untreated rats (A to F) showing lateromedial views, (G to L) anteroposterior views showing.
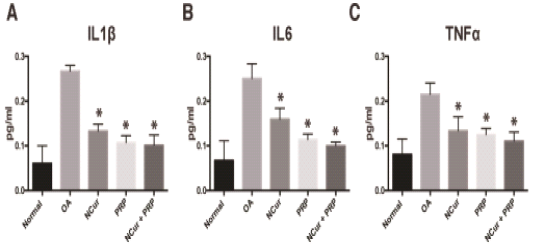
Serum levels of IL1, IL6 and TNFα measured 15 days after treatment with NCur, PRP or NCur + PRP. Each bar represents the average levels from 6 rats (pg/ml) ± SD and (*) indicates P-value <0.05 when compared with untreated rats, Student’s t-test.
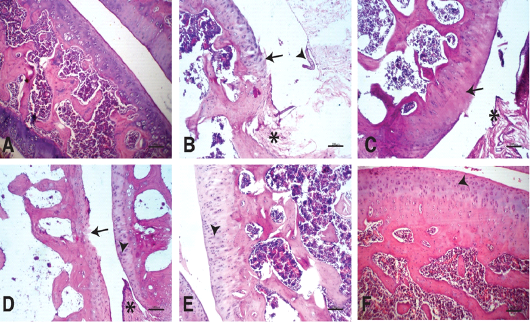
Photomicrographs of knee joints (H & E stain):
A) Normal knee joint. Chondrocytes are viable across all regions of the joint articular surface.
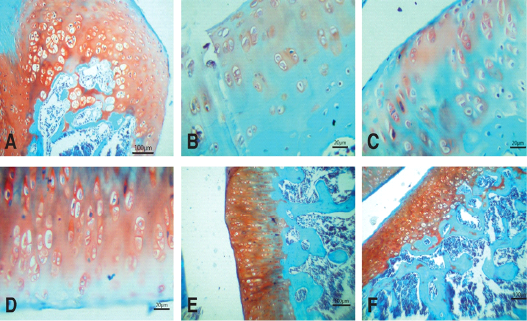
Photomicrographs of knee joints (Safranin O stain).
A) Normal joint. Strong staining of matrix can be seen.
B) Untreated joint 15 days after MIA injection. Very weak staining of matrix is observed.
C) Untreated joint 30 days after MIA injection. Negative staining of matrix is observed.
D) NCur treated joint. Weak staining of matrix is observed.
E) PRP treated joint. Moderate staining of matrix is observed.
F) NCur + PRP treated joint. Strong, uniform matrix staining similar to normal joint.
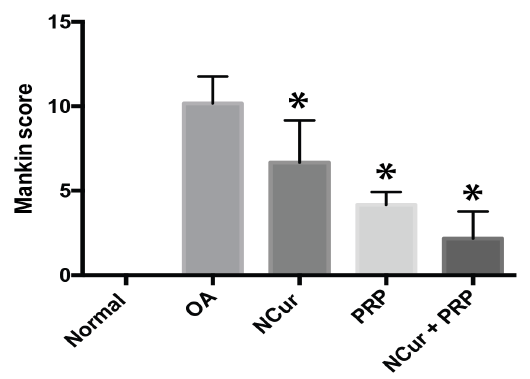
Mankin score of the histopathological lesions 15 days after treatment with NCur, PRP or NCur + PRP. Each bar represents the average levels from 6 rats (pg/ml) ± SD and (*) indicates P-value <0.05 when compared with untreated rats, Student’s t-test.


