Advances in Animal and Veterinary Sciences
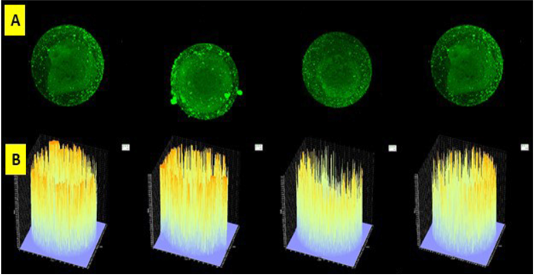
Slice of oocytes with a thickness of 5 µ (A) and read with Olympus Fluoview software version 4.2a. Caspase 3 intensity of frozen oocyte post vitrification group emitted by fluorescent luminescence in caspase 3’s oocyte that binds to secondary antibodies labeled FITC. The higher the intensity of caspase 3 in the oocyte indicated the higher the intensity and profile numbers on the graph were showed by the line density in yellow. The expression and intensity of caspase 3 of frozen oocyte post vitrification group were very high (B).
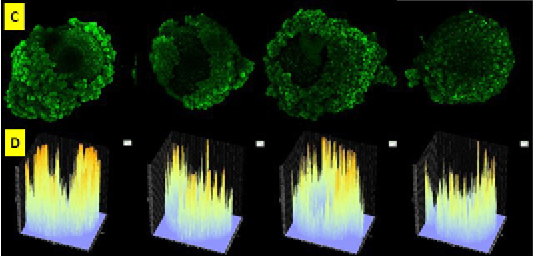
Oocyte slices before checked with Olympus Fluoview software version 4.2a emitted by green fluorescence (C). Graphic image of the intensity of caspase 3 fresh oocyte group emitted by fluorescent luminescence in caspase 3 oocyte that binds to secondary antibodies labeled FITC. The expression and intensity of caspase 3 of fresh oocyte group were lower than frozen oocyte post vitrification group (D).


