Advances in Animal and Veterinary Sciences
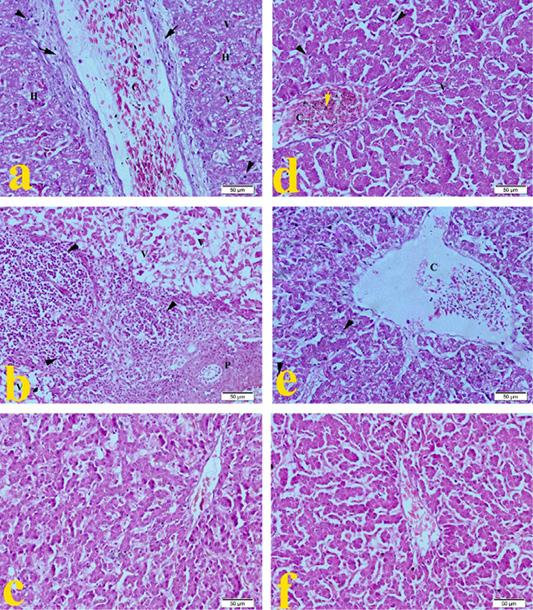
Representative photomicrographs of liver histopathology (20×): (a) Liver of Hubbard broilers challenged with ammonia 75 ppm showing congestion of central vein (C), mild fibrosis (arrow), mononuclear cell infiltration (arrowhead), vaculation of hepatocytes cytoplasm (V). (b) Liver of Hubbard broilers challenged with lead nitrate 0.1 mg.L-1 showing sever vaculation (V) and severe mononuclear cell infiltration (arrowhead) and degeneration of portal area (P). (c) Liver of Hubbard broilers challenged with E. coli O157: H7 1.5x10⁸ CFU/ml. (d) Liver of Hubbard broilers challenged with magnesium sulfate 0.075 mg.L-1. (e) Liver of Hubbard broilers challenged with ammonium chloride 0.005 mg.L-1. (f) Liver of control Hubbard broilers. H and E. Bar 50 μm.
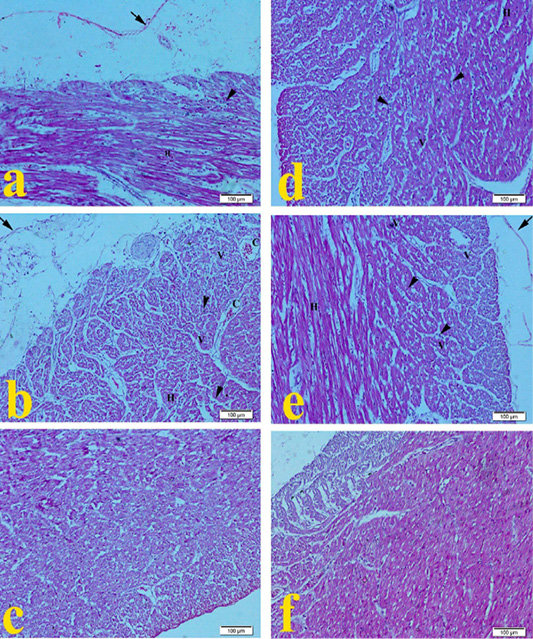
Representative photomicrographs of heart histopathology (10×): (a) Heart of Hubbard broilers challenged with ammonia 75 ppm showing mild hemorrhage (H), mild fibrinous pericarditis (arrow), mononuclear cell infiltration (arrowhead), vaculation of cytoplasm (V). (b) Heart of Hubbard broilers challenged with lead nitrate 0.1 mg.L-1. (c) Heart of Hubbard broilers challenged with E. coli O157: H7 1.5x10⁸ CFU/ml. (d) Heart of Hubbard broilers challenged with magnesium sulfate 0.075 mg.L-1. (e) Heart of Hubbard broilers challenged with ammonium chloride 0.005 mg.L-1. (f) Heart of control Hubbard broilers. H and E. Bar 100 μm.
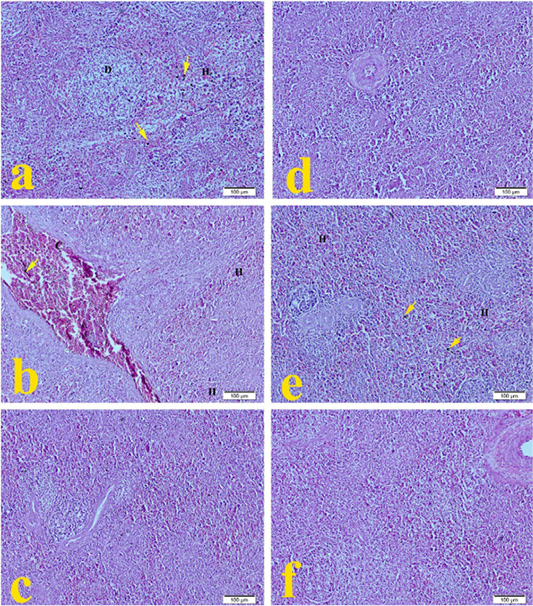
Representative photomicrographs of spleen histopathology (10×): (a) Spleen of Hubbard broilers challenged with ammonia 75 ppm showing depletion of lymphocytes (D), mild hemorrhage (H), and hemosiderosis (yellow arrow). (b) The spleen of Hubbard broilers challenged with lead nitrate 0.1 mg.L-1. (c) The spleen of Hubbard broilers challenged with E. coli O157: H7 1.5x10⁸ CFU/ml. (d) The spleen of Hubbard broilers challenged with magnesium sulfate 0.075 mg.L-1. (e) The spleen of Hubbard broilers challenged with ammonium chloride 0.005 mg.L-1. (f) The spleen of control Hubbard broilers. H and E. Bar 100 μm.
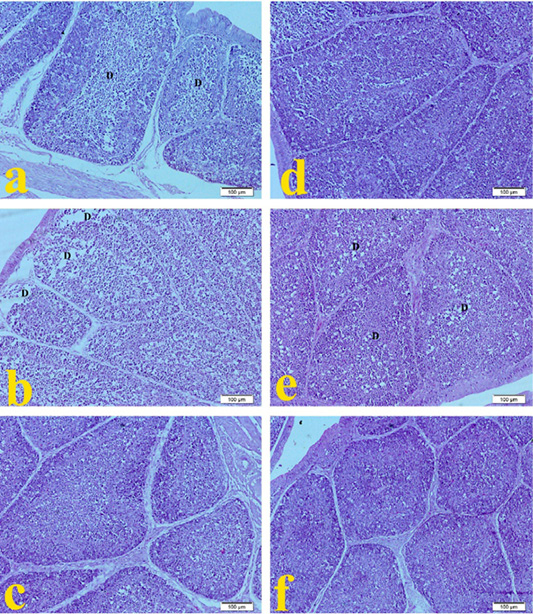
Representative photomicrographs of bursa histopathology (10×): (a) Bursa of Hubbard broilers challenged with ammonia 75 ppm showing depletion of lymphocytes (D). (b) Bursa of Hubbard broilers challenged with lead nitrate 0.1 mg.L-1. (c) Bursa of Hubbard broilers challenged with E. coli O157: H7 1.5x10⁸ CFU/ml. (d) Bursa of Hubbard broilers challenged with magnesium sulfate 0.075 mg.L-1. (e) Bursa of Hubbard broilers challenged with ammonium chloride 0.005 mg.L-1. (f) Bursa of control Hubbard broilers. H and E. Bar 100 μm.


