Advances in Animal and Veterinary Sciences
Research Article

Surveillance of Livestock Diseases with Geographical Information System (GIS), Salem, South India
Kanitha Christy Inbaraj1,3*, Gunasekaran Chinnappan3, Rajkumar Vallavan3, Karthick Kumar Alagamuthu2
1Jiangsu Key Laboratory of Biotechnology and Biodiversity, School of Life Sciences, Nanjing Normal University, Nanjing, P.R. China; 2Jiangsu Key Laboratory for Molecular and Medical Biotechnology, College of Life Sciences, Nanjing Normal University; 3Conservation Biology Laboratory, Bharathiar University, Coimbatore, India.
Kanitha Christy Inbaraj and Karthick Kumar Alagamuthu are contributed equally to this work.
Abstract | The principles of GIS technologies are an incredibly powerful tool in aiding animal health and well suited for the visualization of epidemiological research. Disease surveillance comprised passive and active surveillance. Passive surveillance data were used to calculate the morbidity and mortality rates along with the further comparison of the infected zone (Site 1) and disease-free zone (Site 2). The geo-coordinates of the veterinary centre in each block was marked to create the disease maps by linking the morbidity and mortality data using Spatial Interpolation technique. The value of spatial data in animal disease surveillance demarcates the potential zones for better identification and hence with the assistance of veterinarians, the endemic and disease-free zones were examined and compared to determine the factors for the spread of livestock diseases.
Keywords | Livestock disease, GIS, Active surveillance, Passive surveillance, Epidemiological
Received | June 23, 2020; Accepted | August 08, 2020; Published | September 01, 2020
*Correspondence | Kanitha Christy Inbaraj, Conservation Biology Laboratory, Bharathiar University, Coimbatore, India; Email: kanithainbaraj@gmail.com
Citation | Inbaraj KC, Chinnappan G, Vallavan R, Alagamuthu KK (2020). Surveillance of livestock diseases with geographical information system (GIS), Salem, South India. Adv. Anim. Vet. Sci. 8(11): 1147-1153.
DOI | http://dx.doi.org/10.17582/journal.aavs/2020/8.11.1147.1153
ISSN (Online) | 2307-8316; ISSN (Print) | 2309-3331
Copyright © 2020 Inbaraj et al. This is an open access article distributed under the Creative Commons Attribution License, which permits unrestricted use, distribution, and reproduction in any medium, provided the original work is properly cited.
INTRODUCTION
Animal husbandry is one of the rapidly expanding sectors and plays a significant role in Indian agriculture by supporting livelihood and maintains the economic standards of farmers during the times of drought. Livestock earns additional income to the family for the landless farmers and is the chief asset of the family. Lack of modern surveillance system remains a constraint in the isolated villages of India.
Livestock diseases need special attention and effective control mechanism in case of foot and mouth and Peste des petits diseases, which cause severe impact on the social and economic status of a region. Majority of emerging disease outbreaks diseases are transboundary and stealthily spread worldwide (Olutayo and Babalobi, 2007). In a developing country like India, stringent care for livestock remains a vision and issues such as lack of adequate knowledge on emerging outbreaks; unhygienic practices, illiteracy, poverty, and timely vaccination disrupt the livestock population and also the quality of milk.
A surveillance system is a method of surveillance that may involve one or more component activities that generates information on the health, disease or zoonosis status of animal populations Office International des Epizooties (World Organization for Animal Health OIE, 2012b). Livestock animal diseases are a key constraint on economic growth, poverty reduction, and food security. There are two specific reasons for animal disease surveillance foremost, is the direct impact on the human, followed by economic decline. Study of animal infections helps to control natural infectious disease epidemics. It is necessary to understand how animal disease spreads and how this information can be obtained and monitored on a regular and timely basis (Wurtz and Popovich, 2002).
Geographic information systems (GIS) are the commonly used technologies employed in this information age for capture, storage, retrieval, update, analysis, mapping, and display for the management of animal diseases which creates opportunities for better decision making and sustainable development in under developed countries (Clarke et al., 1996; Freier, 2000; Durr and Gatrell, 2004; Olutayo and Babalobi, 2007). It is a vital tool in veterinary epidemiology, surveillance and monitoring of animal diseases. Such approaches can be used for animal health planning and predicting disease risks to support the farmers indulged in dairy farming.
GIS is used in modeling and mapping to develop a new hypothesis for any geographical location. In spatial epidemiology, it can analyze and predict future disease risks based on the resources available in the particular locality and population (Jacquez, 2000). Epidemiologists employed maps to associatea location, environment, and the disease (Busgeeth, 2004).
Spatial analysis is a methodology used to describe the geographical patterns of disease; these patterns are foundational for understanding the epidemiology and potential risks. GIS creates maps of morbidity and mortality patterns for population density, putative exposures and geographic features with the help of interpolation techniques. Spatial epidemiology has a close link between statistical plots and geographic mapsthat will more directly support pattern identification (Monmonier, 1996; Tweedie, 1997). Defending the livestock industry is crucial, as it employs thousands of people. Mere vaccination is insufficient to control the spread of the disease. Aside from the economic aspect of the issue, increasing the capacity of early response by enhancing diagnosis methods is vital for animal health. An agricultural area, which depends only on the monsoon rain for cultivation, requires powerful crisis management tools for the effective control of animal disease outbreaks.
Worldwide occurrence of emerging diseases outbreaks, animal diseases and human health problems transcend local and international borders, requiring attention to their geographic, spatial and temporal patterns before effective prevention and control (Olutayo and Babalobi, 2007). Conventional tools for epidemiological data management and analysis cannot examine the relationships between adjacent or distant areas and remains inadequately equipped to handle the information on the geographical distribution of disease. Traditional database management systems can handle storage and analysis of the other factors. Nevertheless, the use of a GIS offers the ability to include the spatial distribution of disease in the analysis of all profound factors contributing to the spread of the disease. GIS is one of the veterinary geo-informatic technique of the advanced information age for capture, storage, retrieval, update, analysis, mapping, display, and rapid worldwide communication of data for the management of animal diseases (Freier, 2000).
GIS-based animal health surveillance system enables to determine the degree of the risk zones for disease and associated events, create thematic maps, and explore the landscape features associated with the disease outbreaks with graphically illustrated reports. In the present study, we compared an infected zone with disease-free zone to investigate the infection magnitude and spreading pattern of the livestock diseases. Besides, we documented the demographic characteristics, which included the farmers’ literacy, economy, and livestock maintenance in both zones. This study provided a multi-level information service about the distribution and occurrence of animal diseases for the veterinary department and farmers. Such investigations could enhance the response mechanism of decision-makers to make better decisions in the future.
MATERIALS AND METHODS
Study area
Salem district has the highest number of exotic breed varieties of cattle and contributes significantly to the milk production for the state of Tamil Nadu in India. Salem region has one ADIU Unit (Animal Disease Intelligence Unit), one Polyclinic, Six veterinary hospitals, 94 Veterinary dispensaries, 6 mobile veterinary dispensaries and 31 rural veterinary dispensaries. It has the highest number of exotic breed varieties such as Holstein Friesian, Jersey Crossbred and few indigenous breeds such as Mazha konga, Kangayam, Umblachery and Bargur breeds of Bos taurus (Cow). Among buffalo (Bubalus bublis), the Toda was the only indigenous breed found among the population. Mecheri and Trichy black breed varieties of domestic Goat (Capra aegagrus hircus) and domestic sheep (Ovis aries) were the popular sheep and goat varieties of the district. The livestock population of the district is mentioned in Table 1.
The district records for the frequent disease outbreaks and the existing animal health data management system in Salem district is not able to fully incorporate the spatial component of animal health information. Mostly, spatial data are managed with the use of manually prepared disease maps. A GIS based program was started by Animal Husbandry Department of Tamil Nadu to manage the animal health data, but it did not function until to date.
Table 1: Livestock Population of study area (Source: www.dahd.nic.in/LStock.htm).
| Animals | No. of animals (District) | No. of animals (Site 1) | No. of animals (Site 2) |
| Cattle | 104797 | 12443 | 44753 |
| Goat | 94437 | 13839 | 28593 |
| Sheep | 39852 | 5043 | 19651 |
| Buffaloes | 15429 | 4058 | 3443 |
| Total | 2,54,515 | 35, 383 | 96,440 |
Active and passive surveillance
Disease surveillance was conducted in two steps namely Passive and Active surveillance. In Passive surveillance, we collected the records of disease outbreaks (2011-2018) along with the place of occurrence from the Animal Disease Intelligence Unit of Salem and calculated the mortality and morbidity rates.
Crude measures are an expression of the amount of disease and death in a population as whole; they take no account ofthe structure of the population affected. Crude and specific rates of morbidity, mortality and case fatality were calculated as per the method followed by (Thrusfield, 2007).
| Morbidity Rate = | Number of the animals showing signs of the particular disease | X 100 |
| Total number of susceptible animals under risk for the disease | ||
| Mortality Rate = | Number of the animals died due to the particular disease | X 100 |
| Total number of susceptible animals under risk for the disease |
We assumed a comparative study between two zones would reveal better solutions to the existing diseases and hence created the database to compare the endemic zone (Site-1) with the disease-free area (Site-2) (Figure 1).
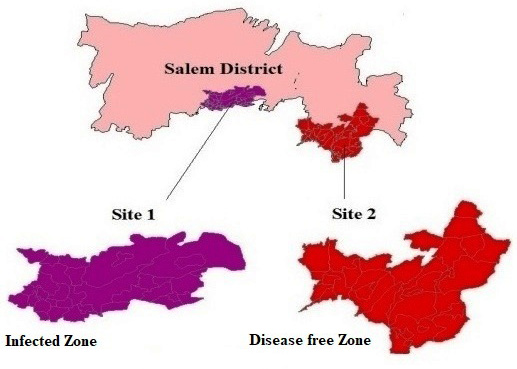
Figure 1: Study area map.
Active surveillance was conducted in infected zone (Site-1) and disease-free zone (Site-2) for a period of twelve months (January to December) in the year 2019. Major outbreaks and other infections in the livestock were documented from the field observations and reports from the farmers. Apart from the major outbreaks, the farmers reported about the reproductive and parasitic diseases from their livestock. From their basic information, we documented the reproductive diseases from field observations and faecal examinations were done to examine the parasitic infections using sedimentation and floating methods. Diseases from active and passive surveillance were grouped into major outbreaks, reproductive and parasitic infections (Figure 2).
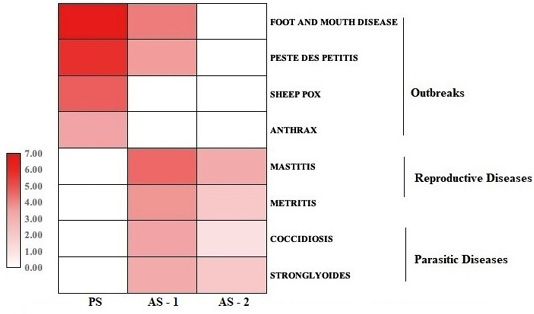
Figure 2: Categorization of the Livestock disease from surveillance: PS, Passive surveillance (20111-2018); (AS-1), Active surveillance in infected zone (Site-1), (2019); (AS-2), Active surveillance in disease-free zone (Site-2), (2019).
Sampling procedure for the livestock farms and individual households
We notified all the local veterinary centers of infected zone (Site-1) and disease- free zone (Site-2) for active surveillance to gather the data of the farmers possessing livestock and the livestock farms in particular areas. A crew of local veterinarians, field assistants, and researchers were assigned specific villages to inspect the farms and households within each village. We connected the disease information to the veterinary dispensaries of the particular village and created the maps by using the geo-coordinates of these centers. Aside from regular visits, the veterinary centers recorded the disease information from the livestock farms and individual owners through phone calls and updated the disease list of the specific region, and consequently, the cases were examined. The study included all the livestock animals of the particular region, irrespective of the small and large-scale farms.
Mapping
Shape files of the district including the villages were downloaded from DIVA-GIS (http://www.diva-gis.org). Mortality and morbidity rates of animal diseases were associated with the geo-coordinates of the veterinary centre of the respected zones. The interpolation method of Inverse Distance Weighting (IDW) helps to create raster surfaces being interpolated as a function of distance from point data by a rather simple procedure (Johnson and Wichern, 2002). IDW provides flexibility in performing good and choice interpolation based on the number of samples and their spatial distribution (Salih-Isam et al., 2002). IDW is dependent on the distance between points in determining the weights of the values (Johnson and Wichern, 2002). The interpolation method considers weighted moving average. The weights are computed using a linear function of distance between sets of points and the points to be predicted (Burroughs and Mc Donell, 1986). IDW interpolation method from ArcGIS software (version 10.1, ESRI Inc.; Redlands, CA, USA) was used to analyse the spatial data of diseases associated with the primary veterinary blocks of the district. IDW inter technique results in a continuous surface of disease concentration and this resultant map was reclassified into five classes as Absence; Mild; Moderate; High and Very High with distinct colours.
Faecal examinations for the parasites
(Animal Disease Surveillance Bulletin, 2009- 2010)
Gastrointestinal parasitism is a major constraint for livestock production causing in heavy economic losses. Studies from different parts of India indicate that variation in the prevalence of parasitic infections from region to region is largely due to climatic factors and the availability of vectors in vector-borne infections.
Sedimentation method
1 to 2 tsp of faeces is thoroughly mixed with 10–15 ml of water. Coarser particles are removed from sieve. This filtrate is centrifuged at 100 rpm for 1 to 2 minutes. The supernatant is discarded and the sediment is examined under the microscope.
Floatation method
5 to 10 faecal pellets of goat or sheep is taken in a container and enough tap water is added and thoroughly mixed until all the faecal material is broken down. The suspension is then centrifuged at 200 rpm for 2 min. The supernatant is discarded and the sediment is examined under the microscope.
Sampling proceure for the socio economic survey
Purposive and simple random sampling techniques were used to select peasant associations and households. Initially, based on the rate of disease incidence and geographical locations, the infected area (Site-1) and disease-free area (Site-2) were purposely selected and compared for the study. Since there was homogeneity regarding the matters that needs to be addressed, hundred and fifty respondents were randomlyselected from both the blocks, forming a total of 300 respondents. Livestock owned by selected respondents were considered as study animals. During the observational study diseased animals were selected and were identified by their disease and name of their owner with location.
Questionnaire
A detailed and organized questionnaire was designed to generate base line information related to livestock diseases with emphasis on major livestock health problems; types of livestock diseases, season of occurrence, source of water and feed, education status, number of trainings undergone in livestock maintenance, types of cattle shed, socio economic status and measures taken by farmers against livestock diseases. The farmers of both sites were interviewed to obtain relevant information about the encountered troubles while maintaining the livestock.
RESULTS AND DISCUSSION
Surveillance through GIS screens for the disease clusters in space, and associates the disease along with the territory. It is necessary to monitor and collect the spatial data relevant to the phenomenon (Krieger et al., 2005). Extensive studies have been done to analyze the relationship between incidence and prevalence associated with environmental and climatic factors (Herbreteau et al., 2005). We collected the passive surveillance data from the year 2011 onwards until 2018, approximately for a period of eight years. Animal disease Unit did not maintain the disease records of the previous years, and hence, we limited the study phase for the available years. Accuracy of spatial data is relatively dependent on the enormous collection of recordings from the study areas. We suggest the veterinary departments of India, to maintain collective records of the past, to interpret future awareness and predictions. However, we conducted the study with the existing data and surprisingly found the associations of diseases within the zones. Passive surveillance data documented four major outbreaks: Foot and Mouth Disease (FMD), Anthrax, Peste Des Petits Ruminants (PPR), and Sheep pox. We linked the mortality and morbidity data of the respective zones, with the geo-coordinates of the nearest veterinary centre, and calculated the mortality/morbidity rates based on the inverse distance weighting method, using Arc Gis software. We identified the disease intense zones with dark colours and disease-free zones with light colours. Spreading pattern of the disease was evidently revealed in vibrant maps. Conversion of table data into colour maps was extra convenient to grasp the central dogma of disease associations with the spreading patterns and identification of endemic zones (Figure 3).
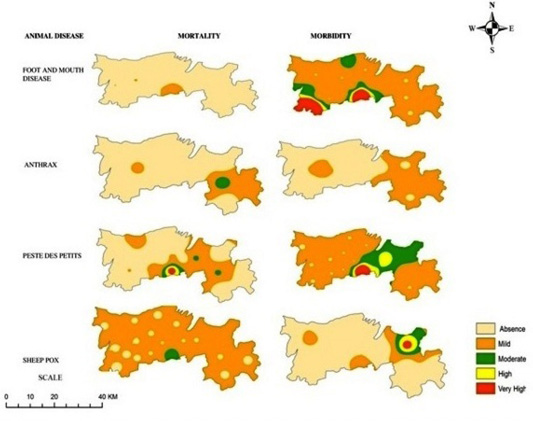
Figure 3: Passive surveillance (2011-2018).
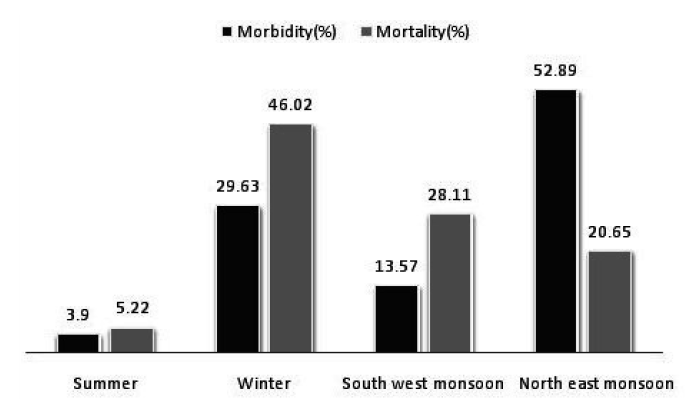
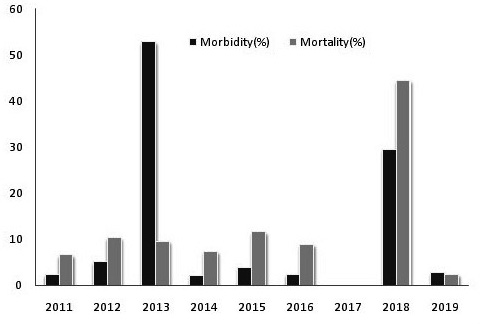
For comparison, we scrutinized the zonal wise mortality and morbidity rates and found the widespread of four outbreaks, Foot and mouth disease, and Peste Des Petits. Although rare prevalence, sheep pox and anthrax disease, caused numerous death in cattle and economic loss to the farmers. During the nine years, 2013 and 2018 had the highest incidence of morbidity and mortality, which mostly occurred during the onset of monsoons (Figures 4 and 5). The highest incidences were during the Northeast monsoon (October-December) and winter (January-February), while Southwest monsoon (June-September) and summer (March-May) had lesser incidences of livestock diseases. With the results from Passive surveillance, endemic zone and disease-free zone were scrutinized for a period of one year (2019). Zones were regularly examined with the assistance of local veterinarians and field assistants. The place of occurrence was geo-referenced with the rural veterinary dispensaries and coordinates were associated with the respective diseases.
Besides the outbreak, few reproductive and parasitic infections were documented. Contagious outbreaks were lacking in disease-free zone (Site-2) whereas infected zone (Site-1) revealed the area of major occurrence (Figure 6). Mastitis and Metritis were the common reproductive diseases that were prevalent during the study period.
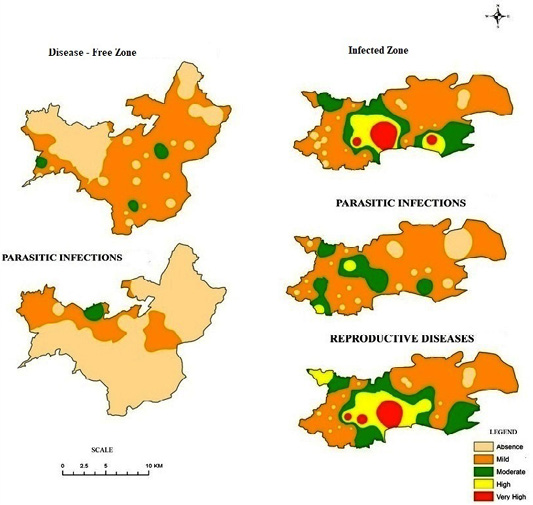
We also observed few parasitic infections from the faecal examinations and identified the infections of Cocciodiosis and Stronglyoides. Disease-free zone had mild and moderate parasitic and reproductive infections but was not severe and could be considered as negligence. Active surveillance conducted in infected zone (Site-1) and disease-free zone (Site-2) revealed the difference in socio economic status, illiteracy, lack of proper animal sheds, unhygienic practices and periodical animal husbandry trainings (Table 2). Infected zone is located quite near the district town and had anthropogenic disturbances in the ecosystem, which was over elevated by public illiteracy and lack of awareness in livestock maintenance.
Table 2: Demographic recordings in infected zone (Site-1) and disease-free zone (Site-2).
| S. No | Category | Group | Site I (%) | Site II (%) | Mean ± SD |
| 1 | No. of respondents | Male | 109 (72.6) | 120 (80) | 114 ± 50 |
| Female | 41(27.3) | 30 (20) | 35 ± 7.77 | ||
| 2 | Age groups | 30 to 40 | 60 (40) | 34 (22.6) | 47 ± 18.38 |
| 40 to 50 | 70 (46.6) | 85 (56.6) | 77 ± 10.60 | ||
| < 50 | 20 (13.3) | 31 (20.7) | 25 ± 7.77 | ||
| 3 | Education | Illiterates | 33 (22) | 16 (10.6) | 24 ± 12.02 |
| Primary level | 14 (9.3) | 34 (22.7) | 24 ± 14.1 | ||
| Secondary level | 40 (26.6) | 15 (10) | 27 ± 17.67 | ||
| Higher sec level | 53 (35.3) | 65 (43.3) | 59 ± 8.48 | ||
| College level | 10 (6.7) | 20 (13.3) | 15 ± 7.07 | ||
| 4 | Major occupation | Agriculture | 20 (13.3) | 31(20.6) | 45.5 ± 36.06 |
| Dairy | 37 (24.6) | 69 (46) | 43 ± 8.48 | ||
| Both | 93 (62) | 50 (33.3) | 61.5 ± 44.54 | ||
| 5 | Land holdings | Land less | 101 (67.3) | 34 (22.6) | 67 ± 47.37 |
| < 1 hectare | 30 (20) | 74 (49.3) | 52 ± 31.11 | ||
| > 1 hectare | 19 (12.6) | 42 (28) | 30.50 ± 16.26 | ||
| 6 | Monthly income | 5 to 10 thousand | 108 (72) | 96 (64) | 97 ± 15.5 |
| > 10 thousand | 42 (28) | 54 (36) | 53 ± 15.55 | ||
| 7 | Type of cattle sheds | Open places | 71 (47.3) | 5 (3.3) | 38 ± 46.66 |
| Palm sheds | 33 (22) | 54 (36) | 43.5 ± 14.84 | ||
| Asbestos sheds | 26 (17.3) | 43 (28.6) | 34.5 ± 12.02 | ||
| Concrete building | 20 (13.3) | 48 (32) | 34 ± 19.79 | ||
| 8 | Experience in dairying | 1 to 5 | 58 (38.6) | 20 (13.3) | 39 ± 26.87 |
| 5 to 10 | 51 (34) | 61 (40.6) | 56 ± 7.07 | ||
| > 10 years | 41 (27.3) | 69 (46) | 55 ± 19.79 | ||
| 9 | Problems reported by farmers | Transport | 20 (13.3) | 67 (44.6) | 43.5 ± 33.23 |
| Water | 55 (36.6) | 24 (16) | 39.5 ± 21.92 | ||
| Feed | 30 (20) | 43 (28.6) | 36.5 ± 9.19 | ||
| Diseases | 45 (30) | 16 (10.6) | 30.50 ± 20.50 | ||
| 10 | Awareness and training undergone | Yes | 59 (39.3) | 98 (65.3) | 78.5 ± 27.57 |
| No | 91 (60.6) | 52 (34.6) | 71.5 ± 27.57 |
Many studies have portrayed the importance of household environment in urban slums as determinants for animal disease transmission (Barcellos and Sabroza, 2001; Reis et al., 2008; Lau et al., 2010). Majority farmers maintained livestock for their household needs and not for professional dairying. Disease-free zone had superior agricultural practices with professional dairy farms. Government established training centres for dairy farming practicing and assistance to the local farmers.
Location of disease-free zone (Site-2) was far off from the township area, ideal for dairy farming practices. Periodical training and experience in dairy farming practices supported the farmers of site (2) to establish a disease-free zone. This is the first comparative study connecting zones associated with spatio-temporal livestock disease, which provided multi-level information about the distribution, occurrence and spreading pattern of disease for the district animal husbandry unit, veterinary department and farmers. Future comparative studies with different interpolation techniques and enormous spatial data could support the veterinarians and the farmers for precautious measures and better decisions.
CONCLUSION
GIS is an effective and prudent tool for the epidemiologists to collect, compile, analyze spatial and temporal trends to plan, target precise decisions and monitor diseases over time. Establishing a livestock epidemic monitoring information system in accordance with the district standards using GlS technology provides a technical support for the construction of animal husbandry units with fewer epidemics. Veterinarians in awareness camps can engage spatial data. Colourful maps create better imitation in the minds of uneducated farmers, which cannot be accomplished by technical documents and advertisements. Maintaining records of the disease information and relative examinations in the regions / locale by GIS analysis could bolster the veterinarians to take effective preventive measures and readiness among the farmers of low-salary nations to prevent animal disease epidemics.
ACKNOWLEDGMENT
We gratefully acknowledge the Director of Animal Disease Intelligence Unit, Salem District for providing us the data for Passive surveillance. The authors express their sincere gratitude to Dr. R.S.D. Babu, Professor and his team, Government Veterinary College, Salem, for their valuable guidance and support throughout the surveillance camp. We are grateful to Indian Institute of Science, Bangalore, India, for their trainings and suggestions in GIS. We thank the dairy farmers for supporting and sharing their personal information with regard to livestock disease.
Authors Contribution
Inbaraj KC and Chinnappan G formulated the idea of the Manuscript; Vallavan R, Alagamuthu KK Collection of data, plotting map; Inbaraj KC wrote the manuscript. All authors read and approved the final manuscript.
CONFLICT OF INTEREST
The authors have declared no conflict of interest.
REFERENCES


