Advances in Animal and Veterinary Sciences
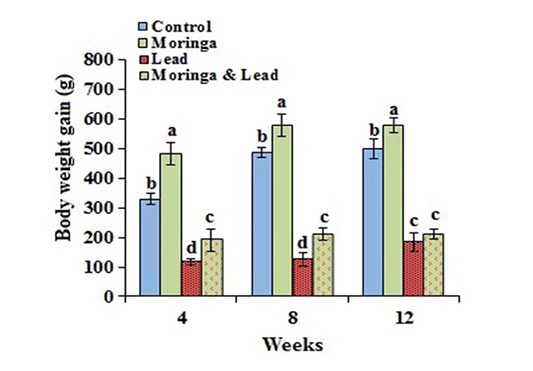
Body weight gain of male rabbits exposed to lead acetate and/or Moringa oleifera ethanol extract (mean SD, N = 5). Means with different letters (a, b, c, d) in the same period are significant at P<0.05.
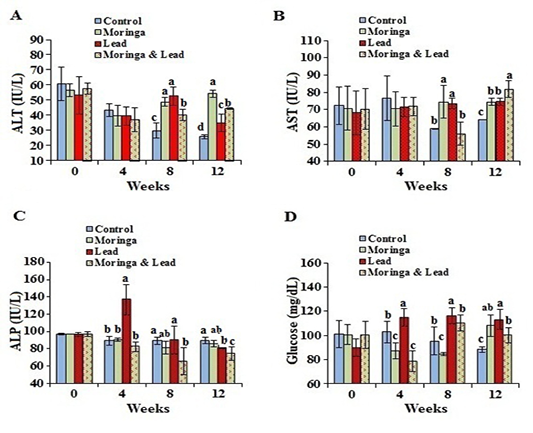
Serum enzymes activity and glucose of male rabbits exposed to lead acetate and/or Moringa oleifera ethanol extract. (A) alanine aminotransferase (ALT), (B) aspartate aminotransferase (AST), (C) alkaline phosphatase (ALP), (D) glucose concentrations (mean SD, N = 5). Means with different letters (a, b, c, d) in the same period are significant at P<0.05.
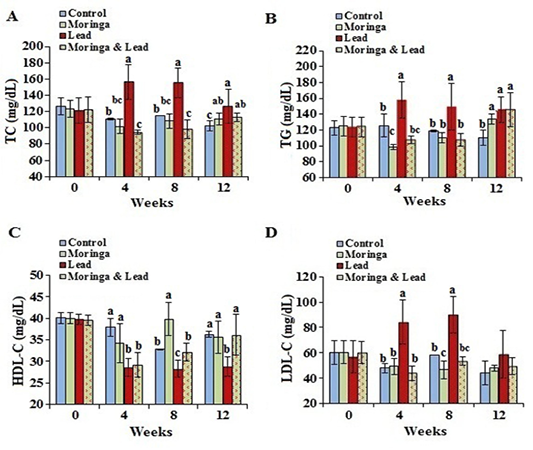
Serum lipid profile of male rabbits exposed to lead acetate and/or Moringa oleifera ethanol extract. (A) total cholesterol (TC), (B) triglycerides (TG), (C) high-density lipoprotein cholesterol (HDL-C), (D) low-density lipoprotein cholesterol (LDL-C) (mean SD, N = 5). Means with different letters (a, b, c) in the same period are significant at P<0.05.
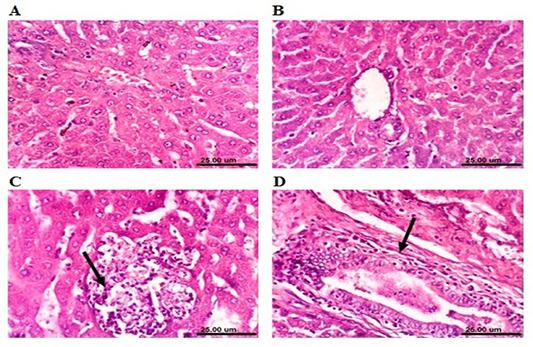
Photomicrograph sections from liver of a male rabbit. (A) Normal control group showing the normal histological structure of hepatic lobule. (B) Moringa oleifera leaf ethanol extract- (MOLEE-) treated group (4 weeks) showing no histopathological alterations. (C) Moringa oleifera extract-treated group (8 weeks) showing focal hepatic necrosis associated with inflammatory cell infiltration (arrow). (D) Moringa oleifera extract-treated group (12 weeks) showing hyperplasia of biliary epithelium and fibroplasia around the bile duct (arrow). (H&E, scale bar: 25 µm)

Photomicrograph sections from liver of a male rabbit. (A) Lead-intoxicated group (4 weeks) showing cytoplasmic vacuolization of hepatocytes (arrow). (B) Lead-intoxicated group (8 weeks) showing focal hepatocellular necrosis associated with inflammatory cell infiltration (arrow). (C) Lead-intoxicated group (12 weeks) showing hyperplasia of the biliary epithelium (arrowhead) and chronic cholangitis (arrow). (D) Moringa oleifera leaf ethanol extract- (MOLEE-) lead-intoxicated group (4 weeks) showing slight cytoplasmic vacuolization of hepatocytes (arrow). (E) MOLEE-lead-intoxicated group (8 weeks) showing slight hydropic degeneration of hepatocytes (arrow). (F) MOLEE-lead-intoxicated group (12 weeks) showing congestion of central vein (arrow) and vacuolar degeneration of hepatocytes (arrowhead). (H&E, scale bar: 25 µm).
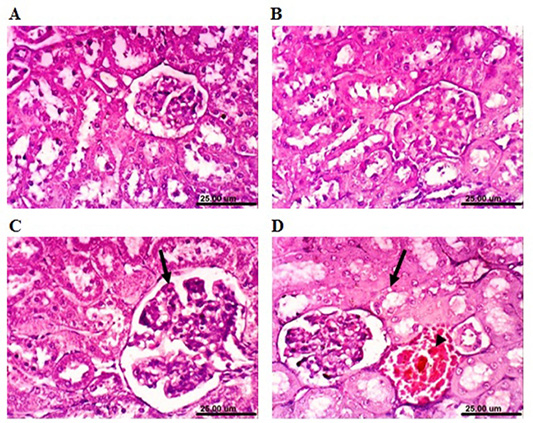
Photomicrograph sections from kidney of a male rabbit. (A) Normal control rabbits showing the normal histological architecture of renal parenchyma. (B) Moringa oleifera leaf ethanol extract- (MOLEE-) treated group (4 weeks) showing no histopathological alterations. (C) MOLEE-treated group (8 weeks) showing hypertrophy and vacuolation of glomerular tuft (arrow). (D) MOLEE-treated group (12 weeks) showing vacuolation of epithelial lining renal tubules (arrow) and renal blood vessel congestion (arrowhead). (H&E, scale bar: 25 µm).
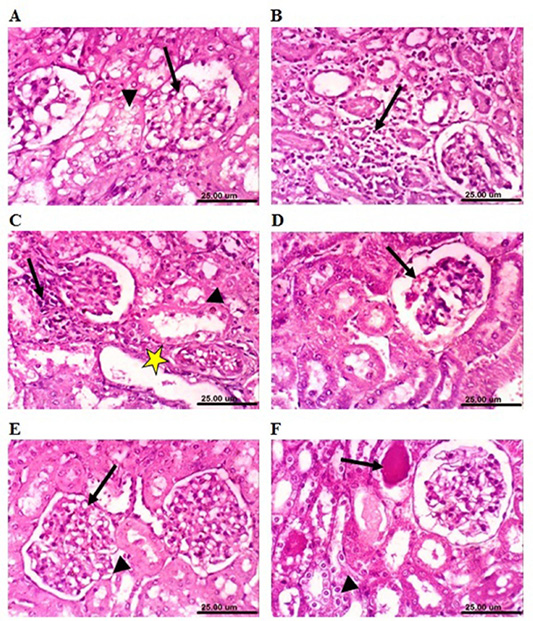
Photomicrograph sections from kidney of a male rabbit. (A) Lead-intoxicated group (4 weeks) showing vacuolation of epithelial lining renal tubules (arrowhead) and endothelial lining glomerular tuft (arrow). (B) Lead-intoxicated group (8 weeks) showing interstitial nephritis (arrow). (C) Lead-intoxicated group (12 weeks) showing vacuolation of epithelial lining renal tubules (arrowhead), focal necrosis of renal tubules (arrow), and cystic dilatation of renal tubules (yellow asterisk). (D) Moringa oleifera leaf ethanol extract- (MOLEE-) lead-intoxicated group (4 weeks) showing slight congestion of glomerular tuft (arrow). (E) MOLEE-lead-intoxicated group (8 weeks) showing slight vacuolation of epithelial lining renal tubules (short arrow) and endothelial lining glomerular tuft (arrow). (F) MOLEE-lead-intoxicated group (12 weeks) showing cytoplasmic vacuolation of epithelial lining renal tubules (short arrow) and eosinophilic proteinaceous cast in the lumen of renal tubules (arrow). (H&E, scale bar: 25 µm).


