Advances in Animal and Veterinary Sciences
Research Article
Adv. Anim. Vet. Sci. 8(10): 1050-1056
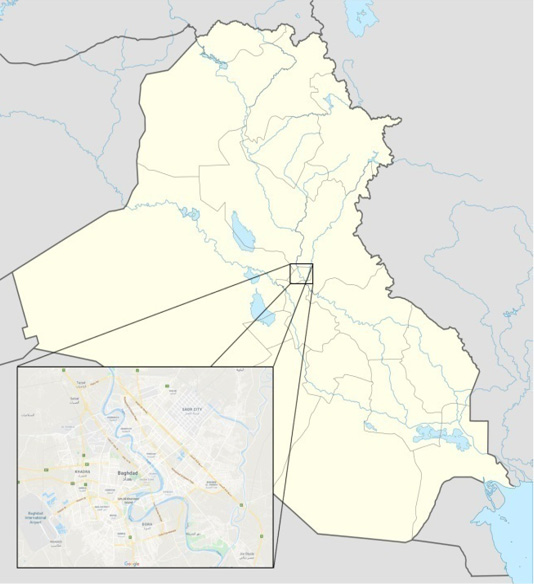
Figure 1
Map of Iraq showing the situation of Baghdad city in central Iraq.
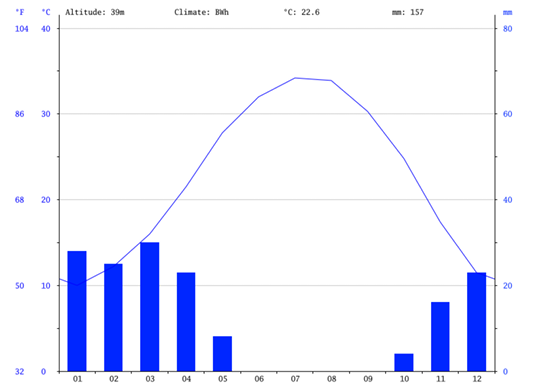
Figure 2
The climate chart of Baghdad city showing monthly mean temperature (continuous line) and precipitation (bars). (from Climate-Data.org, 2019).
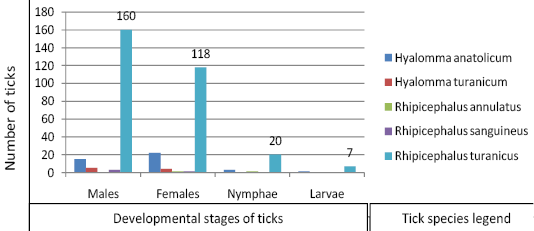
Figure 3
A histogram comparison of domestic goat infestation with 5 species of ixodid ticks including numbers of males, females, nymphs, and larvae.


