Advances in Animal and Veterinary Sciences
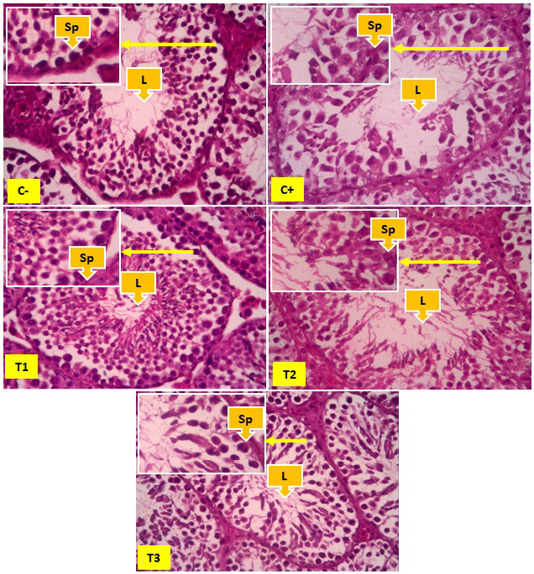
Overview of spermatogonia cells in seminiferous tubules, yellow arrows show spermatogonia cells (Sp), and Lumen (L). In Figure 1 it appears that the number of spermatonia was more common in the negative control group (C-) than the positive control group (C+). The number of spermatogonia appears to be increasing, although not significantly found in the T1, T2 and T3 groups.
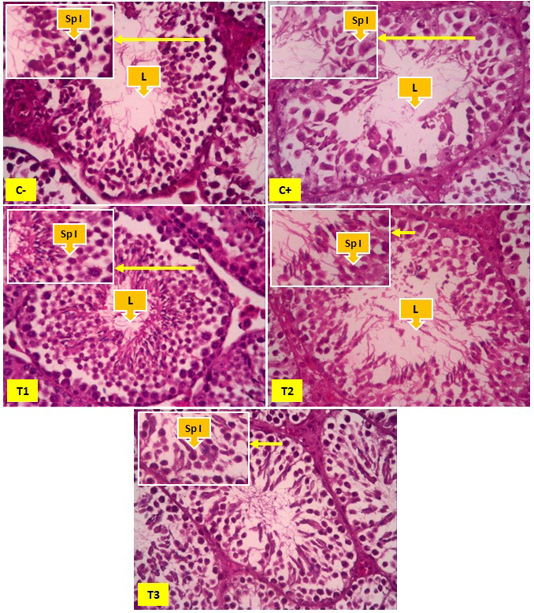
Overview of spermatocyte cells in the seminiferous tubules, yellow arrows indicate primary spermatocyte cells (Sp I) and Lumen (L). In Figure 2 it appears that the number of primary spermatocyte cells was more common in the negative control group (C-) than the positive control group (C+), T1 and T2. The number of primary spermatocyte cells appears to be increasing significantly found in the T3 groups.
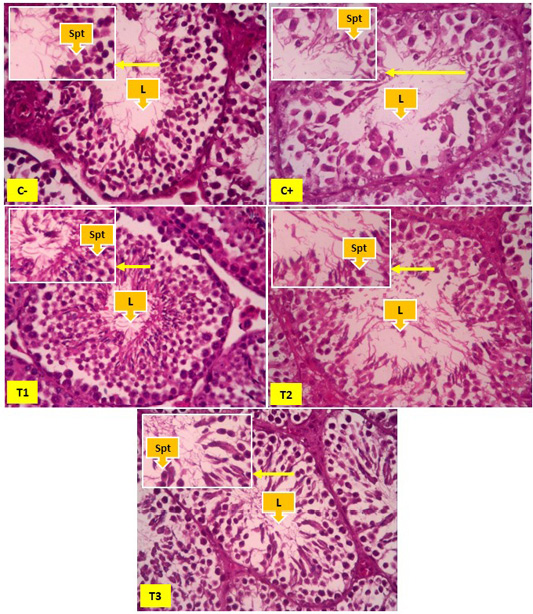
Spermatid cells in seminiferous tubules, yellow arrows showing spermatid cells (Spt) and Lumen (L). In Figure 2 it appears that the number of spermatid cells was more common in the negative control group (C-) than the positive control group (C+), T1 and T2. The number of spermatid cells appears to be increasing significantly found in the T3 groups.


