Advances in Animal and Veterinary Sciences
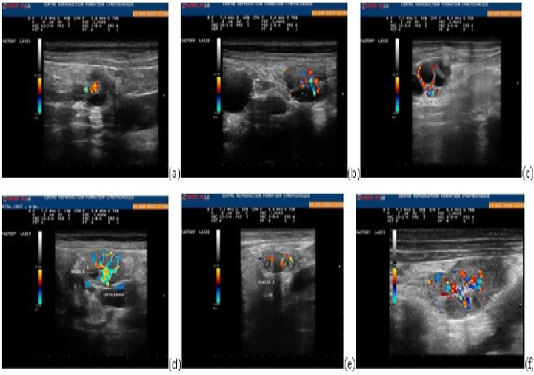
Figure 1
Ovarian parenchyma color-Doppler ultrasonographic images showing blood flow changes during the different phases of the cycle: end of the proestrus (a), three days before ovulation (b), one day before ovulation (c), ovulation (d), one day after ovulation (e), four days after ovulation (f).
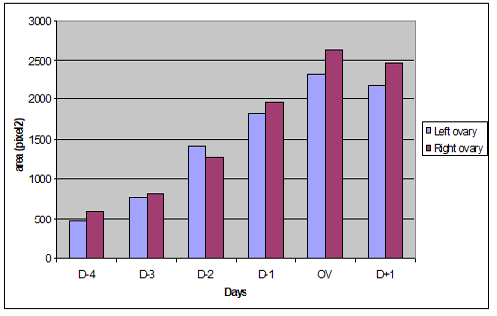
Figure 2
Evolution of the colored Doppler area (pixel) during the pre and post ovulatory phase in the left and right ovaries.
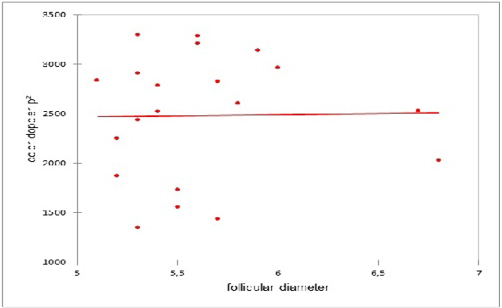
Figure 3
Correlation between the number of the preovulatory follicle and the colored Doppler area (pixel) on the day of ovulation
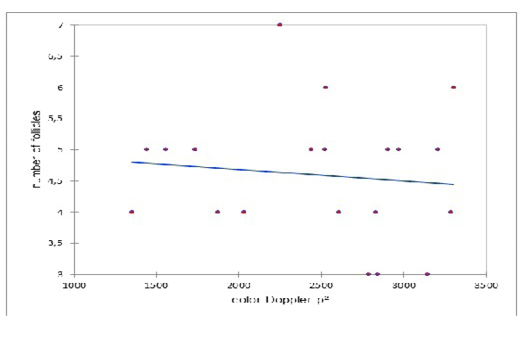
Figure 4
Correlation between the diameter of the preovulatory follicle and the colored Doppler area (pixel) on the day of ovulation


